BNZ – BusinessNZ
Performance of
Services Index

A red start to Spring – PSI

15 Oct, 2012

The service sector fell into technical contraction for the first time since mid-2010, according to the BNZ – BusinessNZ Performance of Services Index (PSI).

The PSI for September was 49.6. This was down 0.4 points from August, and the first time the index had moved into contraction since July 2010 (A PSI reading above 50.0 indicates that the service sector is generally expanding; below 50.0 that it is declining). Compared to previous September results, the 2012 value was the second lowest recorded since 2008.

BusinessNZ chief executive Phil O’Reilly said that even though the September result was only a minor dip into declining waters, the trend over recent months indicated this was no real surprise.

“Given new orders/sales had been slipping for the last three months, this had also affected activity/sales levels. Combined with stagnating employment and supplier deliveries, results meant the overall PSI would struggle to reverse declining levels of expansion over the mid part of 2012.

“The next question then becomes whether further declines in activity will occur in the months leading up to Christmas? While we would hope that Xmas provides some uplift, comments from respondents outline a general sense of tough times in the business community, with reduced demand/activity a common thread.”

BNZ economist Doug Steel said, “The soggy September Performance of Services Index adds to recent indicators suggesting slower economic growth in the second half of 2012, following what was a very solid performance in the first half. We are more convinced that growth has slowed. The question remains whether it can bounce back through 2013 as generally positive consumer and business expectations suggest it will.”

The seasonally adjusted BNZ – BusinessNZ Performance of Composite Index or PCI (which combines the PMI and PSI) for September showed the two options for measuring the PCI again both in contraction. The GDP-Weighted Index (49.1) decreased a further 0.5 points from August, with its second lowest result for September. The Free-Weighted Index (48.8) again faired slightly worse, as well as being the first time since mid 2009 that both indices have been in contraction in consecutive months.

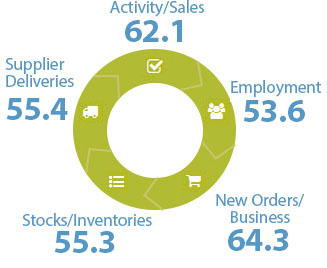
Three of the five main sub-indices were in contraction during September. Stocks/inventories (52.6) led the way for the first time since November 2008. New orders/business (52.0) remained in positive territory, although continued its trajectory downwards with a forth consecutive fall and its lowest value since July 2010. Activity/sales (49.1) fell into contraction for the first time since December 2011, although both employment (48.5) and supplier deliveries (48.6) both improved from the previous, albeit still in contraction.

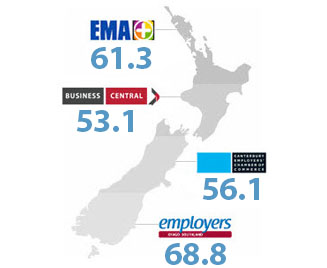
Two of the four regions were in contraction during September. In the North Island, the Northern region (52.9) bounced back from contraction in August, and led the way for the current month. In contrast, the Central region (48.7) fell 9.2 points after seven consecutive months in expansion. In the South Island, the Canterbury/Westland region (50.7) recovered from a dip in August, while the Otago/Southland region (48.5) improved from the previous month, but continued to hover within the 45-50 point mark.

Click here to view the September PSI & PCI
Click here to view the PSI time series data
Click here to view the PCI time series data

For media comment: Doug Steel 04 474 6923

BNZ - BusinessNZ PSI

Time Series Data

View seasonally adjusted and unadjusted time series data for the BNZ - BusinessNZ PSI

Services Landscape

Sponsor Statement

BNZ is delighted to be associated with the Performance of Services Index (PSI) and BusinessNZ.

This association brings together the significant experience of leading business advocacy body BusinessNZ, and business finance specialist BNZ.

We look forward to continuing our association with BusinessNZ and associated regional organisations, and to playing our part in the ongoing development of the New Zealand service sector.

PSI Time Series Table

The results are seasonally adjusted.

BNZ – BusinessNZ PSI Time Series

January 1966 – January 1970

International Results

J.P. Morgan Global Manufacturing PSITM

About the PSI

The BNZ – BusinessNZ Performance of Services Index is a monthly survey of the service sector providing an early indicator of activity levels.

A PSI reading above 50 points indicates service activity is expanding; below 50 indicates it is contracting.

The main PSI and sub-index results are seasonally adjusted.

Technical Contact

Stephen Summers
Economist, BusinessNZ

[email protected]

PSI Releases

Lost momentum

New Zealand’s services sector fell back into contraction during March, according to the BNZ – BusinessNZ Performance of Services Index (PSI). The PSI for March was 47.5 (A PSI reading above 50.0 indicates that the service sector is generally expanding; below 50.0 that...

Path of expansion

New Zealand’s services sector continued its path of expansion in February, according to the BNZ – BusinessNZ Performance of Services Index (PSI). The PSI for February was 53.0 (A PSI reading above 50.0 indicates that the service sector is generally expanding; below...

Green shoots?

New Zealand’s services sector climbed back into expansion for the start of 2024, according to the BNZ – BusinessNZ Performance of Services Index (PSI). The PSI for January was 52.1 (A PSI reading above 50.0 indicates that the service sector is generally expanding;...

Activity on holiday

New Zealand’s services sector fell back into contraction during December, according to the BNZ – BusinessNZ Performance of Services Index (PSI). The PSI for December was 48.8 (A PSI reading above 50.0 indicates that the service sector is generally expanding; below...

Over the line

New Zealand’s services sector recorded expansion in November, according to the BNZ – BusinessNZ Performance of Services Index (PSI). The PSI for November was 51.2 (A PSI reading above 50.0 indicates that the service sector is generally expanding; below 50.0 that it is...

BNZ – BusinessNZ
Performance of
Composite Index

PCI Time Series Table

The results are seasonally adjusted.

BNZ – BusinessNZ PCI Time Series

January 1966 – January 1970

About the PCI

The BNZ – BusinessNZ Performance of Composite Index (PCI) takes into account results from both the Performance of Manufacturing Index (PMI) and the Performance of Services Index (PSI). Combined results are shown in two ways:

GDP-Weighted Index:
Apportions the weight of the manufacturing and services index within the economy to produce an overall result.

Free-Weighted Index:
Combines data from both indexes to produce an overall result.

Both time series for the PCI are then seasonally adjusted.

BNZ - BusinessNZ PCI

Time Series Data

View seasonally adjusted and unadjusted time series data for the BNZ - BusinessNZ PCI

Our Contributors

The BNZ – BusinessNZ PSI contains data obtained through BusinessNZ’s regional organisations