BNZ – BusinessNZ
Performance of
Services Index

Uptick in activity – PSI

19 Nov, 2018
55.4
October
+1.2

Monthly Change

expanding
faster rate

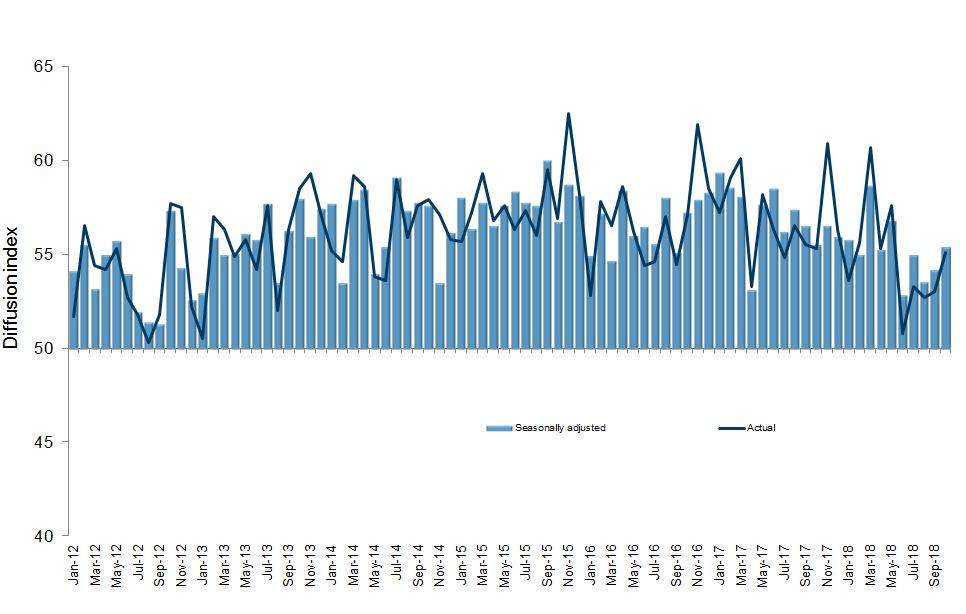
New Zealand’s services sector experienced a second consecutive improvement in expansion levels, according to the BNZ – BusinessNZ Performance of Services Index (PSI).

The PSI for October was 55.4, which was 1.2 points higher than September (A PSI reading above 50.0 indicates that the service sector is generally expanding; below 50.0 that it is declining).  It was also above the long term average of 54.5 for the survey.

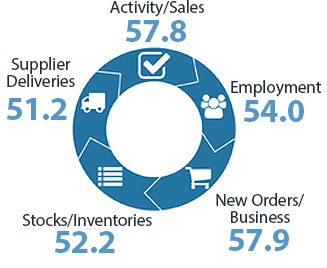
BusinessNZ chief executive Kirk Hope said that the lift in October was due to the main sub-index values showing improvement.

“Activity/sales (57.8) returned to levels last experienced in July, while new orders/business (57.9) recovered somewhat after a drop in expansion levels the previous month.  Also, after four consecutive months around the no change/contraction level, employment (54.0) increased to its highest value since December 2017.

The proportion of positive comments in October (56.5%) was up on both September (50.7%) and August (56.0%), with a combination of comments centred on either business as usual or new business/clients”.

BNZ Senior Economist Craig Ebert said that “it wasn’t just the PSI that improved in October.  So too did the month’s Performance of Manufacturing Index (PMI), overall. Combined, they were starting to form a picture, that any near-term slowdown in economic growth will likely be contained”.

Kirk Hope

Kirk Hope

CEO, BusinessNZ

BNZ - BusinessNZ PSI

Time Series Data

View seasonally adjusted and unadjusted time series data for the BNZ - BusinessNZ PSI

Services Landscape

The PSI

Having been in slowdown mode for much of this year, New Zealand’s Performance of Services Index (PSI) showed signs of resilience in October. It lifted to a seasonally adjusted level of 55.4, a tad above its historical average (54.5).
Read more

Employment

Of the many positive aspects to October’s PSI it was hard to go past its employment index. This jumped to 54.0, from the 6-year low that was September (49.7).
Read more

GDP Implications

Of course, it wasn’t just the PSI that improved in October.  So too did the month’s Performance of Manufacturing Index (PMI), overall. Combined, they were starting to form a picture, that any near-term slowdown in economic growth will likely be contained.
Read more

Global

We finish this month’s missive with a word on the global economy. To be sure, there are signs that its growth is slowing, especially with eyes on Asia and Europe.
Read more

Craig Ebert

Craig Ebert

Senior Economist, BNZ

Sponsor Statement

BNZ is delighted to be associated with the Performance of Services Index (PSI) and BusinessNZ.

This association brings together the significant experience of leading business advocacy body BusinessNZ, and business finance specialist BNZ.

We look forward to continuing our association with BusinessNZ and associated regional organisations, and to playing our part in the ongoing development of the New Zealand service sector.

PSI Time Series Table

The results are seasonally adjusted.

National Indicies Oct
2017
Jun
2018
Jul
2018
Aug
2018
Sep
2018
Oct
2018
BNZ – BusinessNZ PSI 55.5 52.8 55.0 53.5 54.2 55.4
Activity/Sales 57.9 54.8 57.9 54.0 56.2 57.8
Employment 50.8 49.9 49.9 50.0 49.7 54.0
New Orders/Business 60.5 58.3 59.8 58.6 56.2 57.9
Stocks/Inventories 51.5 50.8 51.2 52.0 53.8 52.2
Supplier Deliveries 53.1 48.1 51.0 52.6 52.3 51.2

BNZ – BusinessNZ PSI Time Series

October 2014 – October 2018

International Results

J.P. Morgan Global Manufacturing PSITM

06 Nov 2018
53.4

About the PSI

The BNZ – BusinessNZ Performance of Services Index is a monthly survey of the service sector providing an early indicator of activity levels.

A PSI reading above 50 points indicates service activity is expanding; below 50 indicates it is contracting.

The main PSI and sub-index results are seasonally adjusted.

Technical Contact

Stephen Summers
Economist, BusinessNZ

[email protected]

PSI Releases

Lost momentum

New Zealand’s services sector fell back into contraction during March, according to the BNZ – BusinessNZ Performance of Services Index (PSI). The PSI for March was 47.5 (A PSI reading above 50.0 indicates that the service sector is generally expanding; below 50.0 that...

Path of expansion

New Zealand’s services sector continued its path of expansion in February, according to the BNZ – BusinessNZ Performance of Services Index (PSI). The PSI for February was 53.0 (A PSI reading above 50.0 indicates that the service sector is generally expanding; below...

Green shoots?

New Zealand’s services sector climbed back into expansion for the start of 2024, according to the BNZ – BusinessNZ Performance of Services Index (PSI). The PSI for January was 52.1 (A PSI reading above 50.0 indicates that the service sector is generally expanding;...

Activity on holiday

New Zealand’s services sector fell back into contraction during December, according to the BNZ – BusinessNZ Performance of Services Index (PSI). The PSI for December was 48.8 (A PSI reading above 50.0 indicates that the service sector is generally expanding; below...

Over the line

New Zealand’s services sector recorded expansion in November, according to the BNZ – BusinessNZ Performance of Services Index (PSI). The PSI for November was 51.2 (A PSI reading above 50.0 indicates that the service sector is generally expanding; below 50.0 that it is...

BNZ – BusinessNZ
Performance of
Composite Index

55.2

GDP-Weighted Index

54.5

Free-Weighted Index

The seasonally adjusted BNZ – BusinessNZ Performance of Composite Index or PCI (which combines the PMI and PSI) saw the two options for measuring the PCI both improve from the previous month.

The October GDP-Weighted Index (55.2) increased 1.4 points from September, while the Free-Weighted Index (54.5) rose 1.3 points.  The fact that both the manufacturing and services sectors showed higher expansion levels in October meant a lift for both measurements.

PCI Time Series Table

The results are seasonally adjusted.

National Indicies Oct
2017
Jun
2018
Jul
2018
Aug
2018
Sep
2018
Oct
2018
GDP-Weighted Index 55.8 52.9 54.5 53.3 53.8 55.2
Free-Weighted Index 56.4 53.3 53.8 53.2 53.2 54.5

BNZ – BusinessNZ PCI Time Series

October 2014 – October 2018

About the PCI

The BNZ – BusinessNZ Performance of Composite Index (PCI) takes into account results from both the Performance of Manufacturing Index (PMI) and the Performance of Services Index (PSI). Combined results are shown in two ways:

GDP-Weighted Index:
Apportions the weight of the manufacturing and services index within the economy to produce an overall result.

Free-Weighted Index:
Combines data from both indexes to produce an overall result.

Both time series for the PCI are then seasonally adjusted.

BNZ - BusinessNZ PCI

Time Series Data

View seasonally adjusted and unadjusted time series data for the BNZ - BusinessNZ PCI

Our Contributors

The BNZ – BusinessNZ PSI contains data obtained through BusinessNZ’s regional organisations