BNZ – BusinessNZ
Performance of Services Index

BNZ – BusinessNZ
Performance of
Services Index

Fuel prices impacting service sector performance

48.9

April

+2.7

Monthly Change

Contracting

Slower rate

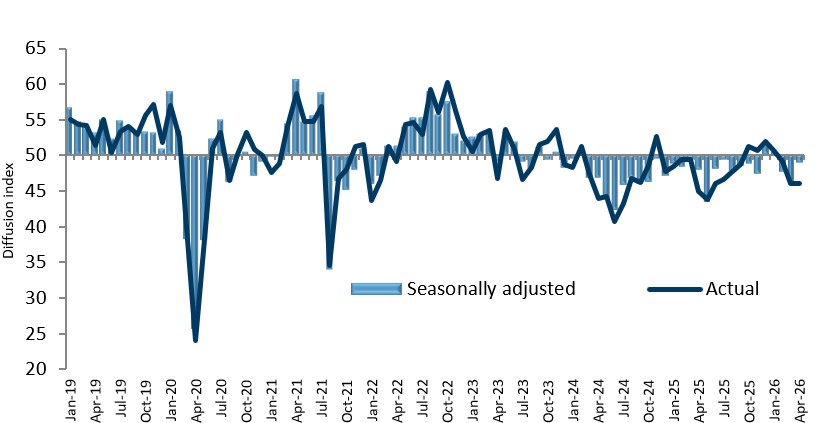
According to the BNZ – BusinessNZ Performance of Services Index (PSI) the services sector in New Zealand contracted in April, albeit more slowly than in March.

The PSI for April was 48.9 (where a reading above 50.0 indicates the sector is generally expanding, and a reading below 50.0 indicates the sector is in contraction). The PSI reading for March was 46.2.

BusinessNZ’s CEO, Katherine Rich said “More than two-thirds of the respondents commented that the factors influencing their business during the past month were negative, and many of the comments focused on fuel prices. With the continuing conflict affecting shipping through the Strait of Hormuz, it is difficult to foresee a quick return to expansion in the sector.”

Despite the generally weak performance of the sector, the New Order sub-index was in expansion, at 51.2. However, all four of the other sub-indexes were showing contraction, with the weakest being Supplier Deliveries at 46.6.

Micro-businesses (those with 1-10 employees) were finding it particularly tough in April, with their sub-index reading at 44.4, but Medium-Large firms (with 51-100 employees) seem to be in healthy expansion at a sub-index level of 55.5.

BNZ’s Head of Research, Stephen Toplis said that “At first glance the jump in the headline index from 46.2 in March to 48.9 in April might be read as hope the New Zealand economy is proving to be remarkably resilient to the war in the Middle East. On the other hand, it could be interpreted as further evidence the economy is struggling to get its head above water.”

Activity/Sales
48.9
Employment
48.5
New Orders/
Business
51.2
Stocks/Inventories
47.6
Supplier
Deliveries
46.6
48.0
45.7
40.2
51.1

Katherine Rich

CEO, BusinessNZ

Services Landscape

Services struggling

We tend toward the interpretation that the PSI provides further evidence the economy is struggling to get its head above water, especially when the detail is investigated.

Read more

Little hope for the unemployed

Of particular concern to us is that the employment indicator remained below the “breakeven” 50 mark for the 29th consecutive month.

Read more

Economy stalls in Q2

The combined employment index for manufacturing and services indicates that there is no current employment growth.

Read more

Discretionary spending the fall guy

With household real disposable income under pressure the first spending to feel the pinch is the discretionary sort.

Read more

Stephen Toplis

Head of Research, BNZ

Sponsor Statement

BNZ is delighted to be associated with the Performance of Services Index (PSI) and BusinessNZ.

This association brings together the significant experience of leading business advocacy body BusinessNZ, and business finance specialist BNZ.

We look forward to continuing our association with BusinessNZ and associated regional organisations, and to playing our part in the ongoing development of the New Zealand service sector.

PSI Time Series Table

The results are seasonally adjusted

National Indicies Apr 2025 Dec 2026 Jan 2026 Feb 2026 Mar 2026 Apr 2026
BNZ – BusinessNZ PSI 48.0 51.6 50.6 47.7 46.2 48.9
Activity/Sales 46.8 52.3 53.7 47.6 44.7 48.9
Employment 47.7 49.6 49.0 47.1 46.6 48.5
New Orders/Business 49.7 52.5 51.4 49.0 46.0 51.2
Stocks/Inventories 48.5 52.2 49.2 46.5 46.2 47.6
Supplier Deliveries 45.9 49.7 49.2 48.4 47.2 46.6

BNZ - BusinessNZ PSI Time Series

January 2019 – April 2026

International Results

J.P. Morgan Global Manufacturing PSI

06 May 2026
51.2
USA
51.0
UK
52.7
Eurozone
47.6
China
52.6
Japan
51.2
Australia
50.7
NZ
48.9

About The PSI

The BNZ – BusinessNZ Performance of Services Index is a monthly survey of the service sector providing an early indicator of activity levels.

A PSI reading above 50 points indicates service activity is expanding; below 50 indicates it is contracting.

The main PSI and sub-index results are seasonally adjusted.

Technical Contact

Mark Cox
Economist, BusinessNZ

[email protected]

BNZ – BusinessNZ
Performance of
Composite Index

48.6

GDP-Weighted Index

49.4

Free-Weighted Index

Reflecting the ongoing weakness of the PSI, the seasonally adjusted BNZ – BusinessNZ Performance of Composite Index or PCI (which combines the PMI and PSI) showed a decline.  The Manufacturing component of the PCI was slightly in expansion in April, but the much larger Services component kept the overall PCI below 50.0.

Nonetheless, both the GDP-weighted index and the Free-weighted index contracted less in April than they did in March.

PCI Time Series Table

The results are seasonally adjusted

National Indicies Apr 2025 Dec 2025 Jan 2026 Feb 2026 Mar 2026 Apr 2026
GDP-Weighted Index 48.0 52.2 51.0 48.4 46.9 48.6
Free-Weighted Index 50.1 53.8 52.2 50.1 48.7 49.4

BNZ - BusinessNZ PCI Time Series

January 2020 – April 2026

About The PCI

The BNZ – BusinessNZ Performance of Composite Index (PCI) takes into account results from both the Performance of Manufacturing Index (PMI) and the Performance of Services Index (PSI). Combined results are shown in two ways:

GDP-Weighted Index:
Apportions the weight of the manufacturing and services index within the economy to produce an overall result.

Free-Weighted Index:
Combines data from both indexes to produce an overall result.

Both time series for the PCI are then seasonally adjusted.

Our Contributors

The BNZ – BusinessNZ PSI contains data obtained through BusinessNZ’s regional organisations