BNZ – BusinessNZ
Performance of Services Index

BNZ – BusinessNZ
Performance of
Services Index

55.8

September

-2.8

Monthly Change

expanding

slower rate

Expansion levels for New Zealand’s services sector eased off in September, according to the BNZ – BusinessNZ Performance of Services Index (PSI).

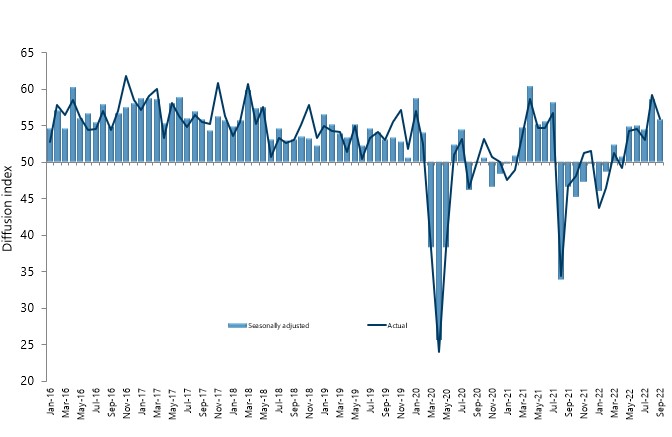
The PSI for September was 55.8 (A PSI reading above 50.0 indicates that the service sector is generally expanding; below 50.0 that it is declining).  This was down 2.8 points from August, but still above the long-term average of 53.6 for the survey.

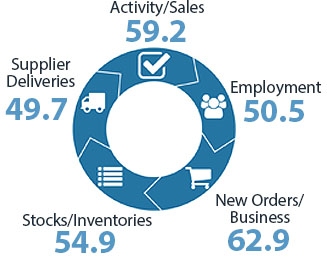
BusinessNZ chief executive Kirk Hope said that the survey was still showing ongoing expansion, with the two key sub-indexes of New Activity/Sales (59.2) and New Orders/Business (62.9) remaining in a very healthy position. Stocks/inventories (54.9) pulled back from August, while Employment (50.5) and Supplier Deliveries (49.7) showed little to no change from the previous month.

In line with the overall drop in expansion levels, the proportion of positive comments for September (47.9%) reverted back to being behind the proportion of negative comments. Staffing problems, supply chain disruptions and offshore issues continued to be the key negative influences on businesses surveyed.

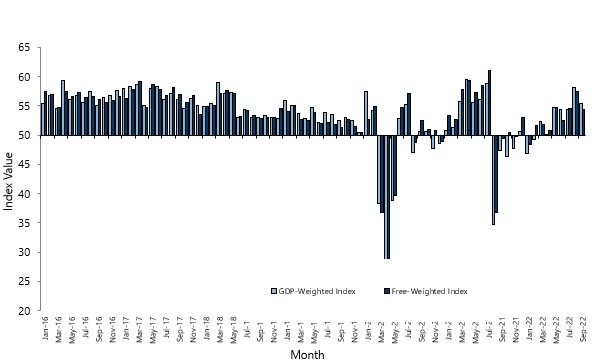
BNZ Senior Economist Craig Ebert said that “the composite PCI held together at 54.4 in free-weighted terms, while the GDP weighted composite came in at 55.4, from 58.2 in August. These marry with our view that Q3 GDP increased about 1.0%”.

Kirk Hope

CEO, Business NZ

Services Landscape

PSI

Broadly speaking, the Performance of Services Index (PSI) stayed strong in September. While its seasonally adjusted result, of 55.8, couldn’t match the bumper 58.6 result of August, it kept comfortably above its long-term norm, nonetheless.

Read more

Industry features

While the PSI’s industry detail remained varied, a greater majority of it struck an expansive tone in September (based on the unadjusted indices given).

Read more

Comparison/contrast to the QSBO

While the PSI gave a very upbeat message about services growth through the September quarter, this was not quite what respondents to the latest NZIER Quarterly Survey of Business Opinion (QSBO) parlayed.

Read more

Growth implications

Taken at face value – and combined with the slower PMI for September – the latest PSI forms a picture of decent economic expansion for Q3.

Read more

Craig Ebert

Senior Economist, BNZ

Sponsor Statement

BNZ is delighted to be associated with the Performance of Services Index (PSI) and BusinessNZ.

This association brings together the significant experience of leading business advocacy body BusinessNZ, and business finance specialist BNZ.

We look forward to continuing our association with BusinessNZ and associated regional organisations, and to playing our part in the ongoing development of the New Zealand service sector.

PSI Time Series Table

The results are seasonally adjusted

National Indicies Sep 2021 May 2022 Jun 2022 Jul 2022 Aug 2022 Sep 2022
BNZ – BusinessNZ PSI 46.6 54.8 54.9 54.4 58.6 55.8
Activity/Sales 43.1 59.1 55.9 54.8 67.5 59.2
Employment 51.2 48.8 52.7 49.3 50.7 50.5
New Orders/Business 47.8 61.7 61.3 53.7 66.6 62.9
Stocks/Inventories 51.7 54.7 54.0 53.4 59.6 54.9
Supplier Deliveries 41.4 46.0 48.9 47.7 49.7 49.7

BNZ - BusinessNZ PSI Time Series

January 2016 – September 2022

International Results

J.P. Morgan Global Manufacturing PSI

05 Oct 2022
49.7

Stephen Summers

Economist, BusinessNZ

About The PSI

The BNZ – BusinessNZ Performance of Services Index is a monthly survey of the service sector providing an early indicator of activity levels.

A PSI reading above 50 points indicates service activity is expanding; below 50 indicates it is contracting.

The main PSI and sub-index results are seasonally adjusted.

Technical Contact

Mark Cox
Economist, BusinessNZ

[email protected]

BNZ – BusinessNZ
Performance of
Composite Index

55.4

GDP-Weighted Index

54.4

Free-Weighted Index

The seasonally adjusted BNZ – BusinessNZ Performance of Composite Index or PCI (which combines the PMI and PSI) saw the two options for measuring the PCI both show lower levels of expansion in September.

The September GDP-Weighted Index (55.4) decreased 2.8 points from August, while the Free-Weighted Index (54.4) fell 3.1 points.

PCI Time Series Table

The results are seasonally adjusted

National Indices Sep 2021 May 2022 Jun 2022 Jul 2022 Aug 2022 Sep 2022
GDP-Weighted Index 47.4 54.7 54.4 54.4 58.2 55.4
Free-Weighted Index 49.5 54.8 52.5 54.5 57.5 54.4

BNZ - BusinessNZ PCI Time Series

January 2016 – September 2022

About The PCI

The BNZ – BusinessNZ Performance of Composite Index (PCI) takes into account results from both the Performance of Manufacturing Index (PMI) and the Performance of Services Index (PSI). Combined results are shown in two ways:

GDP-Weighted Index:
Apportions the weight of the manufacturing and services index within the economy to produce an overall result.

Free-Weighted Index:
Combines data from both indexes to produce an overall result.

Both time series for the PCI are then seasonally adjusted.

Our Contributors

The BNZ – BusinessNZ PSI contains data obtained through BusinessNZ’s regional organisations