BNZ – BusinessNZ
Performance of Services Index

BNZ – BusinessNZ
Performance of
Services Index

Moving on up – PSI

56.4

November

+0.7

Monthly Change

expanding

faster rate

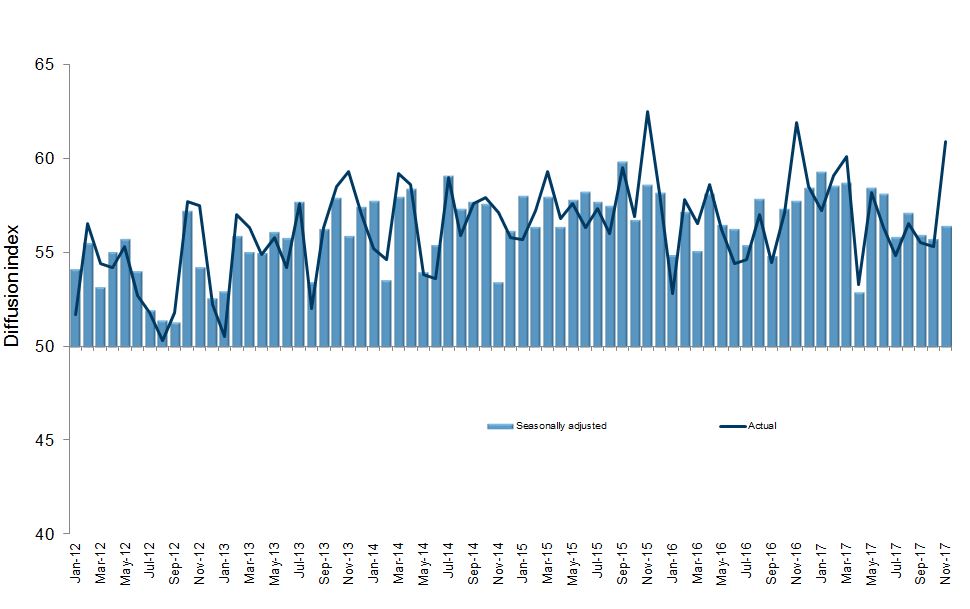
Activity in New Zealand’s services sector lifted slightly during November, according to the BNZ – BusinessNZ Performance of Services Index (PSI).

The PSI for November was 56.4, which was 0.7 points higher than October (A PSI reading above 50.0 indicates that the service sector is generally expanding; below 50.0 that it is declining).  It also stopped two consecutive months of lower expansion in the sector.

BusinessNZ chief executive Kirk Hope said that the sector remains in solid territory, with the slight lift in expansion levels boosted with a pick up in the key sub-indices of both activity/sales (60.5) and new orders/business (60.7).

“It was also good to see the proportion of positive comments for November (68.7%) build on the substantive lift in October (67.6%), with many outlining seasonal factors at play”.

BNZ Senior Economist Doug Steel said that “positive signs were widespread across the PSI with expansionary readings seen in the unadjusted results across all industries, regions, sub components, and firm sizes”.

Kirk Hope

CEO, Business NZ

Services Landscape

Services Solid

Positive signals continue to hold sway in the Performance of Services Index (PSI). November’s 56.4 remains comfortably above its long term average of 54.4 indicating more above average growth in the serve sector.
Read more

Demand Robust

Last week’s electronic card transactions data for November also indicated demand has strengthened. The value of transactions rose a seasonally adjusted 1.4% in the month, with other indicators suggesting positive momentum has continued into December.
Read more

Employment Slower

Just like in October, employment was a relatively softer component of the PSI in November. This may still reflect a period of caution post-election or may be a consequence of employers having difficulty finding appropriate staff.
Read more

Housing

The Real Estate Institute housing figures for November looked better. Sure, November sales were down 8.9% on a year ago, but it represents a claw-back from -15.8% in October and -26.2% in September.
Read more

Doug Steel

Senior Economist, BNZ

Sponsor Statement

BNZ is delighted to be associated with the Performance of Services Index (PSI) and BusinessNZ.

This association brings together the significant experience of leading business advocacy body BusinessNZ, and business finance specialist BNZ.

We look forward to continuing our association with BusinessNZ and associated regional organisations, and to playing our part in the ongoing development of the New Zealand service sector.

PSI Time Series Table

The results are seasonally adjusted

National Indicies Nov
2016
Jul
2017
Aug
2017
Sep
2017
Oct
2017
Nov
2017
BNZ – BusinessNZ PSI 57.8 55.9 57.1 55.9 55.7 56.4
Activity/Sales 63.5 55.7 62.8 56.8 58.2 60.5
Employment 53.0 54.9 52.1 53.4 51.0 50.6
New Orders/Business 61.7 60.1 62.9 60.2 60.3 60.7
Stocks/Inventories 51.7 52.4 52.8 52.8 51.3 58.1
Supplier Deliveries 55.3 52.2 52.9 53.6 52.9 53.2

BNZ - BusinessNZ PSI Time Series

November 2013 – November 2017

International Results

J.P. Morgan Global Manufacturing PSI

05 Dec 2017
53.7

About The PSI

The BNZ – BusinessNZ Performance of Services Index is a monthly survey of the service sector providing an early indicator of activity levels.

A PSI reading above 50 points indicates service activity is expanding; below 50 indicates it is contracting.

The main PSI and sub-index results are seasonally adjusted.

Technical Contact

Mark Cox
Economist, BusinessNZ

[email protected]

BNZ – BusinessNZ
Performance of
Composite Index

56.5

GDP-Weighted Index

57.7

Free-Weighted Index

The seasonally adjusted BNZ – BusinessNZ Performance of Composite Index or PCI (which combines the PMI and PSI) saw the two options for measuring the PCI both experiencing an increase in expansion during November.

The November GDP-Weighted Index (56.5) rose 0.6 points from the previous month, while the Free-Weighted Index (57.7) increased 0.8 points.  Given expansion levels for the manufacturing and services sectors both lifted, this translated into upwards movement for both PCI values during the current month.

PCI Time Series Table

The results are seasonally adjusted

National Indicies Nov
2016
Jul
2017
Aug
2017
Sep
2017
Oct
2017
Nov
2017
GDP-Weighted Index 57.1 55.8 57.2 56.1 55.9 56.5
Free-Weighted Index 56.6 56.1 57.9 56.9 56.9 57.7

BNZ - BusinessNZ PCI Time Series

November 2013 – November 2017

About The PCI

The BNZ – BusinessNZ Performance of Composite Index (PCI) takes into account results from both the Performance of Manufacturing Index (PMI) and the Performance of Services Index (PSI). Combined results are shown in two ways:

GDP-Weighted Index:
Apportions the weight of the manufacturing and services index within the economy to produce an overall result.

Free-Weighted Index:
Combines data from both indexes to produce an overall result.

Both time series for the PCI are then seasonally adjusted.

Our Contributors

The BNZ – BusinessNZ PSI contains data obtained through BusinessNZ’s regional organisations