BNZ – BusinessNZ
Performance of Services Index

BNZ – BusinessNZ
Performance of
Services Index

Negative November – PSI

46.7

November

-4.1

Monthly Change

contracting

previously expanding

Activity in New Zealand’s services sector fell back into contraction during November, according to the BNZ – BusinessNZ Performance of Services Index (PSI).

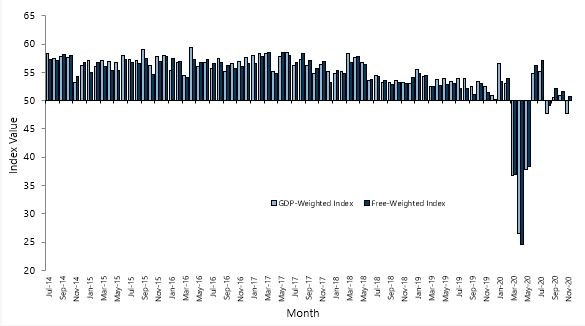
The PSI for November was 46.7, which was down 4.1 points from October (A PSI reading above 50.0 indicates that the service sector is generally expanding; below 50.0 that it is declining).  This was the lowest level of activity since May 2020.  

BusinessNZ chief executive Kirk Hope said that the drop in activity was disappointing to see, but symptomatic of how COVID-19 has caused significant disruption throughout most of 2020.

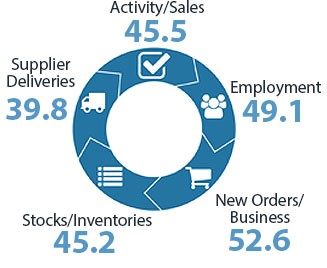
“Almost all of the sub-indices were in contraction during November.  Activity/Sales (45.5) went further in contraction from last month, while New Orders/Business (52.6) experienced lower expansion levels.  Employment (49.1) remained in contraction for the 9th consecutive month, while logistical disruptions continued to be evident with Supplier Deliveries (39.8) at its lowest since April 2020.”

BNZ Senior Economist Craig Ebert said that “the PSI’s 3-month running average was below the 50 breakeven level in November, with a reading of 49.2. This paints a picture of momentum lost, after a couple of months of solid rebound in June and July.”

Kirk Hope

CEO, Business NZ

Services Landscape

The PSI

The caution we touched on last month has taken on extra meaning, with November’s Performance of Services Index (PSI) slipping to 46.7, from 50.8 in October. Indeed, it was an even weaker result than back in August, when Auckland went back into level-3 lockdown and the rest of the country level 2.
Read more

Devil in the Details

With this, it’s natural to ask…what’s behind the weakness?  By major component we would note the exaggerated weakest in Supplier Deliveries, with a seasonally adjusted reading of 39.8 (11.4 points below its long-term average).
Read more

Other details

Delving further into the PSI details and one runs into the fact that many of the sub-indices are not seasonally adjusted.  This is especially important for November, as this is when seasonality in the PSI peaks; when its headline index is typically flattered by 4 points, just because of the time of year.
Read more

Other signs of a slower November

With the contractionary undertones in the latest PSI, we will remain on guard for other signs of slowing momentum (after what’s expected to be a chunky rebound in Q3 GDP, due Thursday).
Read more

Craig Ebert

Senior Economist, BNZ

Sponsor Statement

BNZ is delighted to be associated with the Performance of Services Index (PSI) and BusinessNZ.

This association brings together the significant experience of leading business advocacy body BusinessNZ, and business finance specialist BNZ.

We look forward to continuing our association with BusinessNZ and associated regional organisations, and to playing our part in the ongoing development of the New Zealand service sector.

PSI Time Series Table

The results are seasonally adjusted

National Indicies Nov
2019
Jul
2020
Aug
2020
Sep
2020
Oct
2020
Nov
2020
BNZ – BusinessNZ PSI 53.0 54.4 47.2 50.1 50.8 46.7
Activity/Sales 53.2 55.4 45.6 52.4 49.8 45.5
Employment 50.7 49.5 47.6 49.0 49.6 49.1
New Orders/Business 54.0 55.4 47.9 55.0 57.5 52.6
Stocks/Inventories 59.2 55.5 48.5 44.7 51.8 45.2
Supplier Deliveries 54.3 56.9 45.1 42.9 43.8 39.8

BNZ - BusinessNZ PSI Time Series

November 2016 – November 2020

International Results

J.P. Morgan Global Manufacturing PSI

03 Dec 2020
52.2

About The PSI

The BNZ – BusinessNZ Performance of Services Index is a monthly survey of the service sector providing an early indicator of activity levels.

A PSI reading above 50 points indicates service activity is expanding; below 50 indicates it is contracting.

The main PSI and sub-index results are seasonally adjusted.

Technical Contact

Mark Cox
Economist, BusinessNZ

[email protected]

BNZ – BusinessNZ
Performance of
Composite Index

47.8

GDP-Weighted Index

50.8

Free-Weighted Index

The seasonally adjusted BNZ – BusinessNZ Performance of Composite Index or PCI (which combines the PMI and PSI) saw the two options for measuring the PCI show mixed results during November.

The November GDP-Weighted Index (47.8) decreased 3.2 points from October. The Free-Weighted Index (50.8) decreased 0.8 points, although still remained in expansion.

PCI Time Series Table

The results are seasonally adjusted

National Indices Nov
2019
Jul
2020
Aug
2020
Sep
2020
Oct
2020
Nov
2020
GDP-Weighted Index 52.6 55.1 47.8 50.6 51.0 47.8
Free-Weighted Index 51.5 57.1 49.1 52.1 51.6 50.8

BNZ - BusinessNZ PCI Time Series

November 2016 – November 2020

About The PCI

The BNZ – BusinessNZ Performance of Composite Index (PCI) takes into account results from both the Performance of Manufacturing Index (PMI) and the Performance of Services Index (PSI). Combined results are shown in two ways:

GDP-Weighted Index:
Apportions the weight of the manufacturing and services index within the economy to produce an overall result.

Free-Weighted Index:
Combines data from both indexes to produce an overall result.

Both time series for the PCI are then seasonally adjusted.

Our Contributors

The BNZ – BusinessNZ PSI contains data obtained through BusinessNZ’s regional organisations