BNZ – BusinessNZ
Performance of Services Index

BNZ – BusinessNZ
Performance of
Services Index

On track – PSI

55.8

January

-0.2

Monthly Change

expanding

slower rate

New Zealand’s services sector started 2018 with a healthy level of expansion, according to the BNZ – BusinessNZ Performance of Services Index (PSI).

The PSI for January was 55.8, which was very close to the December result of 56.0 (A PSI reading above 50.0 indicates that the service sector is generally expanding; below 50.0 that it is declining).  

BusinessNZ chief executive Kirk Hope said that the last five months have seen the overall PSI result within a very tight band of just 0.8 points, indicating the sector continues to tick along at a consistent pace.

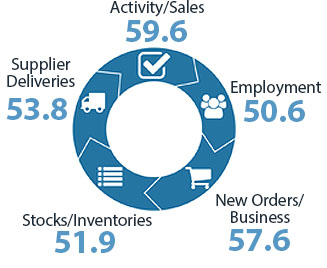
“While the proportion of positive comments for January (59.6%) was largely unchanged from December (60.0%), the sub-index of new orders/business (57.6) fell below the 60.0 point mark for the first time since April 2017.  Given new orders/business is a lead indicator for activity/sales, this will be one to watch in the next few months”.

BNZ Senior Economist Craig Ebert said that “while the PSI is relatively robust, combined with the Performance of Manufacturing Index it nonetheless signals something of a slowing in GDP growth for the near term”.

Kirk Hope

CEO, Business NZ

Services Landscape

The PSI

Over the last year or so the Performance of Services Index (PSI) has come off the boil, but not by all that much. Its January outcome, of 55.8, made for a 3-month average of 56.1.
Read more

Employment

But the PSI hasn’t been entirely bullish. Its employment index has slowed more noticeably than has the overall PSI. Indeed, it subsided to 50.6 in January, after 55.8 in December but also a barely-expanding 50.7 reading back in November.
Read more

GDP

While the PSI is relatively robust, combined with the Performance of Manufacturing Index it nonetheless signals something of a slowing in GDP growth for the near term.
Read more

Population

Population growth also promises to support New Zealand’s rate of economic expansion ahead. Sure, its principle driver, net inward migration, is assumed to moderate – broadly in keeping with the targets that the government has indicated.
Read more

Craig Ebert

Senior Economist, BNZ

Sponsor Statement

BNZ is delighted to be associated with the Performance of Services Index (PSI) and BusinessNZ.

This association brings together the significant experience of leading business advocacy body BusinessNZ, and business finance specialist BNZ.

We look forward to continuing our association with BusinessNZ and associated regional organisations, and to playing our part in the ongoing development of the New Zealand service sector.

PSI Time Series Table

The results are seasonally adjusted

National Indicies Jan
2017
Sep
2017
Oct
2017
Nov
2017
Dec
2017
Jan
2018
BNZ – BusinessNZ PSI 59.3 56.0 55.7 56.5 56.0 55.8
Activity/Sales 60.4 56.8 58.3 60.5 58.5 59.6
Employment 54.3 53.1 51.0 50.7 55.8 50.6
New Orders/Business 64.5 60.3 60.2 60.6 60.1 57.6
Stocks/Inventories 56.8 52.7 51.2 58.6 51.0 51.9
Supplier Deliveries 55.7 53.7 53.0 53.3 50.3 53.8

BNZ - BusinessNZ PSI Time Series

January 2014 – January 2018

International Results

J.P. Morgan Global Manufacturing PSI

05 Feb 2018
54.1

About The PSI

The BNZ – BusinessNZ Performance of Services Index is a monthly survey of the service sector providing an early indicator of activity levels.

A PSI reading above 50 points indicates service activity is expanding; below 50 indicates it is contracting.

The main PSI and sub-index results are seasonally adjusted.

Technical Contact

Mark Cox
Economist, BusinessNZ

[email protected]

BNZ – BusinessNZ
Performance of
Composite Index

55.8

GDP-Weighted Index

55.8

Free-Weighted Index

The seasonally adjusted BNZ – BusinessNZ Performance of Composite Index or PCI (which combines the PMI and PSI) saw the two options for measuring the PCI at the same level of expansion for January.

The January GDP-Weighted Index (55.8) increased 0.4 points from the previous month, while the Free-Weighted Index (55.8) increased 1.8 points.  Given the improvement in manufacturing expansion, this translated into a stronger lift in expansion via the free-weighted method.

PCI Time Series Table

The results are seasonally adjusted

National Indicies Jan
2017
Sep
2017
Oct
2017
Nov
2017
Dec
2017
Jan
2018
GDP-Weighted Index 58.5 56.1 55.9 56.5 55.4 55.8
Free-Weighted Index 56.9 56.9 56.6 57.4 54.0 55.8

BNZ - BusinessNZ PCI Time Series

January 2014 – January 2018

About The PCI

The BNZ – BusinessNZ Performance of Composite Index (PCI) takes into account results from both the Performance of Manufacturing Index (PMI) and the Performance of Services Index (PSI). Combined results are shown in two ways:

GDP-Weighted Index:
Apportions the weight of the manufacturing and services index within the economy to produce an overall result.

Free-Weighted Index:
Combines data from both indexes to produce an overall result.

Both time series for the PCI are then seasonally adjusted.

Our Contributors

The BNZ – BusinessNZ PSI contains data obtained through BusinessNZ’s regional organisations