BNZ – BusinessNZ
Performance of Services Index

BNZ – BusinessNZ
Performance of
Services Index

Ongoing Downturn Persists

48.7

October

+0.4

Monthly Change

Contracting

Slower Rate

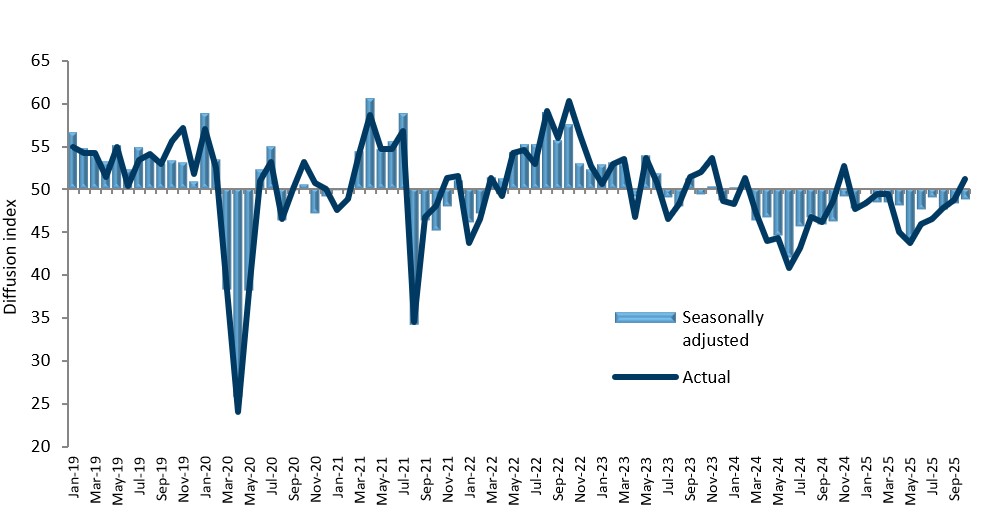
The services sector in New Zealand continues to exhibit contraction, according to the BNZ – BusinessNZ Performance of Services Index (PSI).

The PSI for October was 48.7 (A PSI reading above 50.0 indicates that the service sector is generally expanding; below 50.0 that it is declining). Although this was 0.4 points higher than September, the sector remains entrenched in contraction, which has now been the case for 20 consecutive months. The October result was also still well below the average of 52.8 over the history of the survey.

BusinessNZ’s CEO, Katherine Rich said that while the level of activity in the sector has risen for the second consecutive month, the fact that none of the sub-index results managed to get above 50.0 during October shows it is still tough times for service-based businesses. For the sub-index results, Activity/Sales (48.9) recorded its highest value since January 2025, although New Orders/Business (49.5) slipped slightly from September. In addition, Employment (48.8) rose 0.9 points from September, recording its highest value since March 2025.

The proportion of negative comments for October (54.1%) was down from September (58.0%) and August (59.6%). Negative comments received show the services sector reporting weak demand and reduced customer spending due to the economic downturn, cost-of-living pressures, and low confidence. Rising operating costs, delays, competition, and project cancellations are further reducing sales, slowing activity, and creating cashflow challenges.

BNZ’s Senior Economist Doug Steel said that “if one was trying to find any positive traces in a still broadly weak sector, the activity/sales index rose to its best outcome since January this year and its second-best month since February last year. But 48.9 is not strong”.

Activity/Sales
48.9
Employment
48.8
New Orders/
Business
49.5
Stocks/Inventories
47.6
Supplier
Deliveries
49.5
48.5
50.2
59.3
44.4

Katherine Rich

CEO, BusinessNZ

Services Landscape

PSI

The service sector continues to struggle for forward momentum. October’s Performance of Services Index (PSI) was 48.7.

Read more

To and fro

A better-looking Performance of Manufacturing Index (PMI) last week might have had some starting to entertain thoughts of a quick economic recovery.

Read more

Subpar subcomponents

The PSI’s sub-components made for dreary reading in October. All were below the breakeven 50 mark and below their respective long-term averages.

Read more

Population

There are many drivers of the highly diverse service sector. Population growth is a broad one. Latest figures show the population grew 0.7% in the year to June, a rapid slowing from 1.7% a year earlier and 2.3% in the year before that.

Read more

Doug Steel

Senior Economist, BNZ

Sponsor Statement

BNZ is delighted to be associated with the Performance of Services Index (PSI) and BusinessNZ.

This association brings together the significant experience of leading business advocacy body BusinessNZ, and business finance specialist BNZ.

We look forward to continuing our association with BusinessNZ and associated regional organisations, and to playing our part in the ongoing development of the New Zealand service sector.

PSI Time Series Table

The results are seasonally adjusted

National Indicies Oct 2024 Jun 2025 Jul 2025 Aug 2025 Sep 2025 Oct 2025
BNZ – BusinessNZ PSI 46.2 47.6 49.0 47.6 48.3 48.7
Activity/Sales 44.4 45.1 47.6 46.3 48.0 48.9
Employment 46.4 47.5 47.3 48.5 47.9 48.8
New Orders/Business 47.7 49.1 50.1 48.1 49.7 49.5
Stocks/Inventories 48.0 50.4 51.0 47.1 50.4 47.6
Supplier Deliveries 47.3 46.9 48.7 47.8 46.6 49.5

BNZ - BusinessNZ PSI Time Series

January 2019 – October 2025

International Results

J.P. Morgan Global Manufacturing PSI

06 Nov 2025
53.4
USA
54.8
UK
52.3
Eurozone
53.0
China
52.6
Japan
53.1
Australia
52.5
NZ
48.7

Stephen Summers

Economist, BusinessNZ

About The PSI

The BNZ – BusinessNZ Performance of Services Index is a monthly survey of the service sector providing an early indicator of activity levels.

A PSI reading above 50 points indicates service activity is expanding; below 50 indicates it is contracting.

The main PSI and sub-index results are seasonally adjusted.

Technical Contact

Mark Cox
Economist, BusinessNZ

[email protected]

BNZ – BusinessNZ
Performance of
Composite Index

49.1

GDP-Weighted Index

50.2

Free-Weighted Index

The seasonally adjusted BNZ – BusinessNZ Performance of Composite Index or PCI (which combines the PMI and PSI) showed contrasting results during October.

The October GDP-Weighted Index (49.1) remained in contraction, while the Free-Weighted Index (50.2) displayed slight expansion.

PCI Time Series Table

The results are seasonally adjusted

National Indicies Oct 2024 Jun 2025 Jul 2025 Aug 2025 Sep 2025 Oct 2025
GDP-Weighted Index 46.3 47.9 49.4 48.0 48.6 49.1
Free-Weighted Index 46.6 48.6 50.6 48.6 49.1 50.2

BNZ - BusinessNZ PCI Time Series

January 2020 – October 2025

About The PCI

The BNZ – BusinessNZ Performance of Composite Index (PCI) takes into account results from both the Performance of Manufacturing Index (PMI) and the Performance of Services Index (PSI). Combined results are shown in two ways:

GDP-Weighted Index:
Apportions the weight of the manufacturing and services index within the economy to produce an overall result.

Free-Weighted Index:
Combines data from both indexes to produce an overall result.

Both time series for the PCI are then seasonally adjusted.

Our Contributors

The BNZ – BusinessNZ PSI contains data obtained through BusinessNZ’s regional organisations