BNZ – BusinessNZ
Performance of Services Index

BNZ – BusinessNZ
Performance of
Services Index

Onwards and upwards – PSI

58.2

August

+1.6

Monthly Change

expanding

faster rate

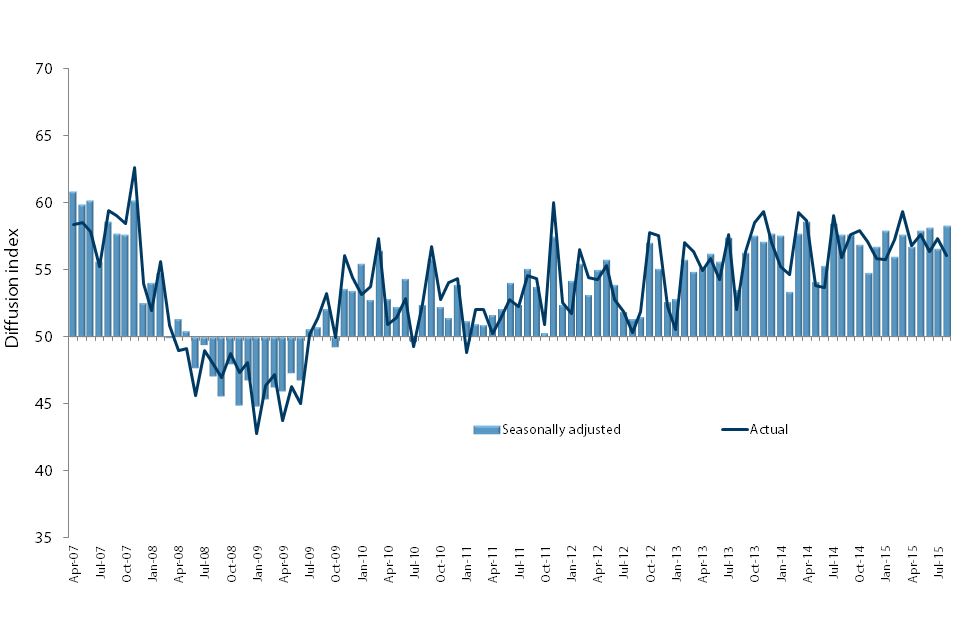
Activity in New Zealand’s services sector reached higher levels in August, according to the BNZ – BusinessNZ Performance of Services Index (PSI).
 
The PSI for August was 58.2.  This was a 1.6 point increase from July, and the highest result since July 2014 (A PSI reading above 50.0 indicates that the service sector is generally expanding; below 50.0 that it is declining).
 
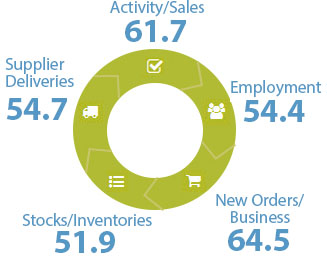
BusinessNZ chief executive Phil O’Reilly said that with the key indicators of activity/sales and new orders consistently above the 60-point mark, it bodes well for continuing growth in the months ahead.

“Although the proportion of positive comments in August (59.2%) was lower than July (64.1%), those who stipulated positive influences noted a combination of business as usual, along with new clients/opportunities present”.
 
BNZ Senior Economist Craig Ebert said that along with the PMI – which also increased in August, to a solid level – the PSI thus paints a picture of an economy growing at a rate much better than normal.

“This is not to deny the headwinds that face the economy. However, we also need to acknowledge that growth in the current (September) quarter could well be shaping up as strong.”

Services Landscape

The PSI

For those who are convinced that the NZ economy is stalling, even losing momentum, look away now.
Read more  

Consumer Spending

Our belief that Q3 GDP growth will be robust has certainly been reinforced by the recent run of electronic cardtransactions.
Read more  

“Selected Services”

As a further sign that growth is holding up, we note that the little-known Selected Services series, as published by Statistics, did OK in Q2.
Read more  

Housing

All the while, the housing market continues to put on the pounds. Granted, the 42% annual jump in REINZ home sales for August partly reflected the subdued activity this time last year, just before the general election.
Read more .

Craig Ebert

Senior Economist, BNZ

Sponsor Statement

BNZ is delighted to be associated with the Performance of Services Index (PSI) and BusinessNZ.

This association brings together the significant experience of leading business advocacy body BusinessNZ, and business finance specialist BNZ.

We look forward to continuing our association with BusinessNZ and associated regional organisations, and to playing our part in the ongoing development of the New Zealand service sector.

PSI Time Series Table

The results are seasonally adjusted

National Indices Aug
2014
Apr
2015
May
2015
Jun
2015
Jul
2015
Aug
2015
BNZ – BusinessNZ PSI 57.6 56.7 57.9 56.6 56.6 58.2
Activity/Sales 58.0 60.5 62.6 60.5 60.5 61.7
Employment 56.6 53.9 56.0 54.4 53.5 54.4
New Orders/Business 59.8 62.7 62.9 62.7 60.5 64.5
Stocks/Inventories 55.4 51.4 50.5 53.4 51.1 51.9
Supplier Deliveries 58.6 50.6 50.5 55.6 54.2 54.7

BNZ - BusinessNZ PSI Time Series

August 2011 – August 2015

International Results

J.P. Morgan Global Manufacturing PSI

03 Sep 2015
54.4

About The PSI

The BNZ – BusinessNZ Performance of Services Index is a monthly survey of the service sector providing an early indicator of activity levels.

A PSI reading above 50 points indicates service activity is expanding; below 50 indicates it is contracting.

The main PSI and sub-index results are seasonally adjusted.

Technical Contact

Mark Cox
Economist, BusinessNZ

[email protected]

BNZ – BusinessNZ
Performance of
Composite Index

57.8

GDP-Weighted Index

57.1

Free-Weighted Index

The seasonally adjusted BNZ – BusinessNZ Performance of Composite Index or PCI (which combines the PMI and PSI) saw the two options for measuring the PCI both experience an increase in expansion for August.
 
The GDP-Weighted Index (57.8) increased 1.7 points, making up the gains lost in July.  The Free-Weighted Index (57.1) rose 1.4 points, which also returned to July levels. Both results indicated stronger expansion compared with the J.P.Morgan Global Combined index of 53.7 for the same month.

PCI Time Series Table

The results are seasonally adjusted

National Indicies Aug
2014
Apr
2015
May
2015
Jun
2015
Jul
2015
Aug
2015
GDP-Weighted Index 57.8 56.1 57.0 57.8 56.1 57.8
Free-Weighted Index 57.3 55.4 55.6 57.1 55.7 57.1

BNZ - BusinessNZ PCI Time Series

August 2011 – August 2015

About The PCI

The BNZ – BusinessNZ Performance of Composite Index (PCI) takes into account results from both the Performance of Manufacturing Index (PMI) and the Performance of Services Index (PSI). Combined results are shown in two ways:

GDP-Weighted Index:
Apportions the weight of the manufacturing and services index within the economy to produce an overall result.

Free-Weighted Index:
Combines data from both indexes to produce an overall result.

Both time series for the PCI are then seasonally adjusted.

Our Contributors

The BNZ – BusinessNZ PSI contains data obtained through BusinessNZ’s regional organisations