BNZ – BusinessNZ
Performance of
Services Index

2 steps back – PSI

16 Dec, 2019
53.3
November
-2.0

Monthly Change

expanding
slower rate

New Zealand’s services sector experienced a dip in expansion levels during November, according to the BNZ – BusinessNZ Performance of Services Index (PSI).

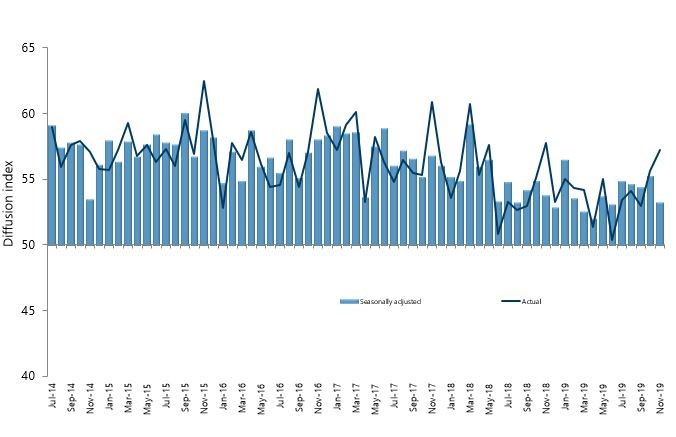
The PSI for November was 53.3, which was 2 points down from October (A PSI reading above 50.0 indicates that the service sector is generally expanding; below 50.0 that it is declining).  The November result was also below the long term average of 54.4 for the survey.

BusinessNZ chief executive Kirk Hope said that despite the improvement in October, the November result was the lowest level of expansion since June

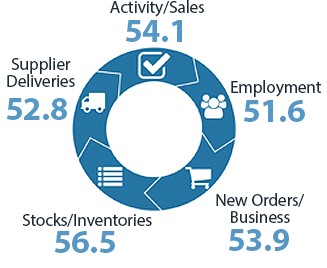
“Looking at the key sub-index values, a key concern is the drop in expansion for new orders/business (53.9), which is at its lowest level since September 2012.  The other key sub-index of activity/sales (54.1) also fell to its lowest point since April 2019.  These results tend to suggest it may be a while longer before we see a sustained level of healthy expansion for the sector.

Looking at comments from respondents, it was good to see a further lift in the proportion of positive comments that went from 50.7% in October to 60.9% in November.

BNZ Senior Economist Craig Ebert said that “the dip in the PSI in November coincided with a slight fall in the Performance of Manufacturing Index (PMI) in the month. Together, these tugged on the reins of GDP growth expectations”.

Kirk Hope

Kirk Hope

CEO, BusinessNZ

BNZ - BusinessNZ PSI

Time Series Data

View seasonally adjusted and unadjusted time series data for the BNZ - BusinessNZ PSI

Services Landscape

The PSI

Having rebounded well through much of this year, New Zealand’s Performance of Services Index (PSI) suffered a knock in November.  Its 2-point dip, to 53.3, put it back below its long-term norm of 54.4.
Read more

GDP

The dip in the PSI in November coincided with a slight fall in the Performance of Manufacturing Index (PMI) in the month. Together, these tugged on the reins of GDP growth expectations. To be sure, we never got carried away in this respect.
Read more

Selective Services

As part of our 0.5% pick for Q3 GDP growth we assume that its service-sector component replicated the sort of momentum they reclaimed in Q2, after a very slow gain in Q1, of 0.3%. And we get a strong signal from the selected-services data for Q3, as published by Statistics NZ.
Read more

Electronic Transactions

After their wobble in October, electronic card transactions needed to bounce to save blushes on Q4 retail trade computations. They didn’t disappoint – up 1.0% overall and 2.6% when looking at the retail category.
Read more

Craig Ebert

Craig Ebert

Senior Economist, BNZ

Sponsor Statement

BNZ is delighted to be associated with the Performance of Services Index (PSI) and BusinessNZ.

This association brings together the significant experience of leading business advocacy body BusinessNZ, and business finance specialist BNZ.

We look forward to continuing our association with BusinessNZ and associated regional organisations, and to playing our part in the ongoing development of the New Zealand service sector.

PSI Time Series Table

The results are seasonally adjusted.

National Indicies Nov
2018
Jul
2019
Aug
2019
Sep
2019
Oct
2019
Nov
2019
BNZ – BusinessNZ PSI 53.8 54.8 54.6 54.4 55.3 53.3
Activity/Sales 53.7 57.2 56.1 54.4 57.9 54.1
Employment 56.4 51.9 53.5 52.5 51.5 51.6
New Orders/Business 58.3 58.5 57.1 59.4 61.9 53.9
Stocks/Inventories 47.6 54.5 53.6 51.6 51.8 56.5
Supplier Deliveries 48.1 49.0 51.7 50.6 49.7 52.8

BNZ – BusinessNZ PSI Time Series

November 2015 – November 2019

International Results

J.P. Morgan Global Manufacturing PSITM

04 Dec 2019
51.6

About the PSI

The BNZ – BusinessNZ Performance of Services Index is a monthly survey of the service sector providing an early indicator of activity levels.

A PSI reading above 50 points indicates service activity is expanding; below 50 indicates it is contracting.

The main PSI and sub-index results are seasonally adjusted.

Technical Contact

Stephen Summers
Economist, BusinessNZ

[email protected]

PSI Releases

Struggle street

New Zealand’s services sector continued to contract further in April, according to the BNZ – BusinessNZ Performance of Services Index (PSI). The PSI for April was 47.1 (A PSI reading above 50.0 indicates that the service sector is generally expanding; below 50.0 that...

Lost momentum

New Zealand’s services sector fell back into contraction during March, according to the BNZ – BusinessNZ Performance of Services Index (PSI). The PSI for March was 47.5 (A PSI reading above 50.0 indicates that the service sector is generally expanding; below 50.0 that...

Path of expansion

New Zealand’s services sector continued its path of expansion in February, according to the BNZ – BusinessNZ Performance of Services Index (PSI). The PSI for February was 53.0 (A PSI reading above 50.0 indicates that the service sector is generally expanding; below...

Green shoots?

New Zealand’s services sector climbed back into expansion for the start of 2024, according to the BNZ – BusinessNZ Performance of Services Index (PSI). The PSI for January was 52.1 (A PSI reading above 50.0 indicates that the service sector is generally expanding;...

Activity on holiday

New Zealand’s services sector fell back into contraction during December, according to the BNZ – BusinessNZ Performance of Services Index (PSI). The PSI for December was 48.8 (A PSI reading above 50.0 indicates that the service sector is generally expanding; below...

BNZ – BusinessNZ
Performance of
Composite Index

53.0

GDP-Weighted Index

52.5

Free-Weighted Index

The seasonally adjusted BNZ – BusinessNZ Performance of Composite Index or PCI (which combines the PMI and PSI) saw the two options for measuring the PCI both decrease from the previous month.

The November GDP-Weighted Index (53.0) decreased 1.9 points from October, while the Free-Weighted Index (52.5) fell 1.8 points.  The fact that both the manufacturing and services sectors displayed lower levels of activity in November caused the two options to measure the PCI to fall.

PCI Time Series Table

The results are seasonally adjusted.

National Indices Nov
2018
Jul
2019
Aug
2019
Sep
2019
Oct
2019
Nov
2019
GDP-Weighted Index 53.7 54.1 54.0 53.8 54.9 53.0
Free-Weighted Index 53.9 52.1 52.0 52.1 54.3 52.5

BNZ – BusinessNZ PCI Time Series

November 2015 – November 2019

About the PCI

The BNZ – BusinessNZ Performance of Composite Index (PCI) takes into account results from both the Performance of Manufacturing Index (PMI) and the Performance of Services Index (PSI). Combined results are shown in two ways:

GDP-Weighted Index:
Apportions the weight of the manufacturing and services index within the economy to produce an overall result.

Free-Weighted Index:
Combines data from both indexes to produce an overall result.

Both time series for the PCI are then seasonally adjusted.

BNZ - BusinessNZ PCI

Time Series Data

View seasonally adjusted and unadjusted time series data for the BNZ - BusinessNZ PCI

Our Contributors

The BNZ – BusinessNZ PSI contains data obtained through BusinessNZ’s regional organisations