BNZ – BusinessNZ
Performance of
Services Index

Consistent service – PSI

18 Jul, 2016
56.7
June
-0.2

Monthly Change

expanding
slower rate

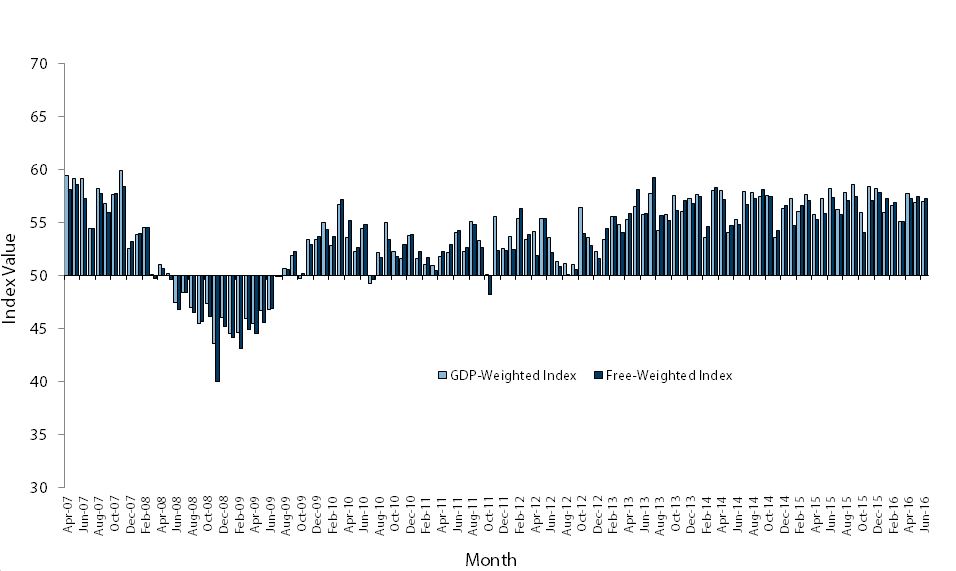
New Zealand’s services sector showed consistent levels of expansion during June, according to the BNZ – BusinessNZ Performance of Services Index (PSI).

The PSI for June was 56.7.  This was very close to the level of activity seen in May (56.9), and above the average of 56.4 for the first 6 months of the year (A PSI reading above 50.0 indicates that the service sector is generally expanding; below 50.0 that it is declining).

BusinessNZ chief executive Kirk Hope said that the result for June continued the trend of healthy expansion, with the sector remaining in a positive position.

“Looking at comments, those who stated their main influences on activity were positive typically mentioned either steady sales or business as usual.  Those stating negative influences instead focused on either seasonal patterns or issues relating to shortages of skilled staff”.

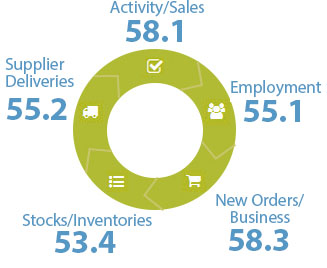
Regarding the latest PSI result, BNZ Senior Economist Craig Ebert said “coming up through the pack was the PSI’s employment index. At 55.1 it fits with a number of other indicators on hiring that are starting to look hefty for New Zealand.”

Kirk Hope

Kirk Hope

CEO, BusinessNZ

BNZ - BusinessNZ PSI

Time Series Data

View seasonally adjusted and unadjusted time series data for the BNZ - BusinessNZ PSI

Services Landscape

The PSI

Much like the PMI did, the Performance of Services Index (PSI) exhibited resilience in June, with an index reading of 56.7. There was also accord in the fact the PSI indicated the fastest rate of expansion was occurring in the North Island.

Read more  

QSBO Services

One of the difficulties in monitoring the services sector is that there are very few general indicators on how it’s all going. But one of those few is from the NZIER’s Quarterly Survey of Business Opinion (QSBO).

Read more  

Retailers

Drilling down into the industry detail of the PSI, its retail trade category was one of the strongest. Its (unadjusted) index result of 57.8 for June brought its 3-month average up to 56.5, compared to 49.2 at the same stage a year ago.

Read more  

Housing/LVR

Despite slightly slower sales, price pressure in the NZ housing market remained clear in June’s Real Estate Institute data. Problematic as this is, the RBNZ feels it has more important issues on its plate, namely trying to drive more inflation into the CPI.

Read more

Craig Ebert

Craig Ebert

Senior Economist, BNZ

Sponsor Statement

BNZ is delighted to be associated with the Performance of Services Index (PSI) and BusinessNZ.

This association brings together the significant experience of leading business advocacy body BusinessNZ, and business finance specialist BNZ.

We look forward to continuing our association with BusinessNZ and associated regional organisations, and to playing our part in the ongoing development of the New Zealand service sector.

PSI Time Series Table

The results are seasonally adjusted.

National Indicies Jun
2015
Feb
2016
Mar
2016
Apr
2016
May
2016
Jun
2016
BNZ – BusinessNZ PSI 56.7 56.8 55.1 57.8 56.9 56.7
Activity/Sales 60.4 60.1 59.8 63.1 60.2 58.1
Employment 53.5 53.7 53.0 53.8 54.7 55.1
New Orders/Business 60.7 61.1 57.4 61.3 60.0 58.3
Stocks/Inventories 51.7 54.4 52.5 52.6 52.4 53.4
Supplier Deliveries 54.4 53.3 51.3 54.5 52.4 55.2

BNZ – BusinessNZ PSI Time Series

June 2011 – June 2015

International Results

J.P. Morgan Global Manufacturing PSITM

05 Jul 2016
51.3

About the PSI

The BNZ – BusinessNZ Performance of Services Index is a monthly survey of the service sector providing an early indicator of activity levels.

A PSI reading above 50 points indicates service activity is expanding; below 50 indicates it is contracting.

The main PSI and sub-index results are seasonally adjusted.

Technical Contact

Stephen Summers
Economist, BusinessNZ

[email protected]

PSI Releases

Struggle street

New Zealand’s services sector continued to contract further in April, according to the BNZ – BusinessNZ Performance of Services Index (PSI). The PSI for April was 47.1 (A PSI reading above 50.0 indicates that the service sector is generally expanding; below 50.0 that...

Lost momentum

New Zealand’s services sector fell back into contraction during March, according to the BNZ – BusinessNZ Performance of Services Index (PSI). The PSI for March was 47.5 (A PSI reading above 50.0 indicates that the service sector is generally expanding; below 50.0 that...

Path of expansion

New Zealand’s services sector continued its path of expansion in February, according to the BNZ – BusinessNZ Performance of Services Index (PSI). The PSI for February was 53.0 (A PSI reading above 50.0 indicates that the service sector is generally expanding; below...

Green shoots?

New Zealand’s services sector climbed back into expansion for the start of 2024, according to the BNZ – BusinessNZ Performance of Services Index (PSI). The PSI for January was 52.1 (A PSI reading above 50.0 indicates that the service sector is generally expanding;...

Activity on holiday

New Zealand’s services sector fell back into contraction during December, according to the BNZ – BusinessNZ Performance of Services Index (PSI). The PSI for December was 48.8 (A PSI reading above 50.0 indicates that the service sector is generally expanding; below...

BNZ – BusinessNZ
Performance of
Composite Index

56.9

GDP-Weighted Index

57.2

Free-Weighted Index

The seasonally adjusted BNZ – BusinessNZ Performance of Composite Index or PCI (which combines the PMI and PSI) saw the two options for measuring the PCI again experience differing directions of activity from May to June.

The June GDP-Weighted Index (56.9) remained unchanged from May, while the Free-Weighted Index (57.2) decreased 0.3 points. Overall, both options remained in healthy expansion for the month.

PCI Time Series Table

The results are seasonally adjusted.

National Indicies Jun
2015
Feb
2016
Mar
2016
Apr
2016
May
2016
Jun
2016
GDP-Weighted Index 58.2 56.6 55.1 57.7 56.9 56.9
Free-Weighted Index 57.3 56.9 55.1 57.3 57.5 57.2

BNZ – BusinessNZ PCI Time Series

June 2011 – June 2015

About the PCI

The BNZ – BusinessNZ Performance of Composite Index (PCI) takes into account results from both the Performance of Manufacturing Index (PMI) and the Performance of Services Index (PSI). Combined results are shown in two ways:

GDP-Weighted Index:
Apportions the weight of the manufacturing and services index within the economy to produce an overall result.

Free-Weighted Index:
Combines data from both indexes to produce an overall result.

Both time series for the PCI are then seasonally adjusted.

BNZ - BusinessNZ PCI

Time Series Data

View seasonally adjusted and unadjusted time series data for the BNZ - BusinessNZ PCI

Our Contributors

The BNZ – BusinessNZ PSI contains data obtained through BusinessNZ’s regional organisations