BNZ – BusinessNZ
Performance of
Services Index

Constant contraction – PSI

14 Feb, 2022
45.9
January
-3.9

Monthly Change

contracting
faster rate

Activity levels in New Zealand’s services sector saw increased levels of contraction during the start of 2022, according to the BNZ – BusinessNZ Performance of Services Index (PSI).

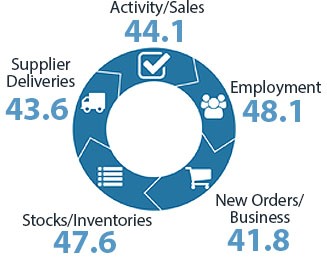
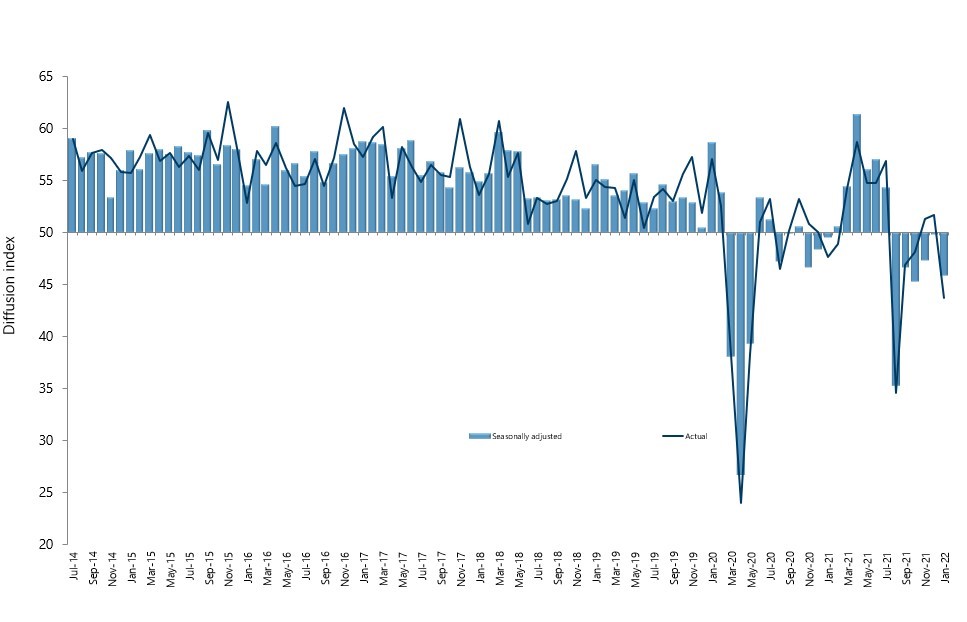
The PSI for January was 45.9 (A PSI reading above 50.0 indicates that the service sector is generally expanding; below 50.0 that it is declining).  This was down 3.9 points from December, and the lowest result since October 2021.

BusinessNZ chief executive Kirk Hope said that despite the last two months of 2021 steadily building towards the no change mark of 50.0, the January result puts the sector squarely back in contraction that has now been the case for six consecutive months.  Such a time series of contraction last occurred in 2008 at the height of the Global Financial Crisis. 

“The key sub-indexes of New Orders/Business (41.8) and Activity/Sales (44.1) both experienced a significant drop in activity levels, while Employment (48.1) was at its lowest point since January 2021.”

BNZ Senior Economist Craig Ebert said that “the PSI can jag around quite a lot from month to month – upwards and downwards. However, it’s also worth pointing out that the long-term average of the PSI is 53.6, which is starting to feel some distance away. So much for the new traffic light system releasing the brakes on activity.”

Kirk Hope

Kirk Hope

CEO, BusinessNZ

BNZ - BusinessNZ PSI

Time Series Data

View seasonally adjusted and unadjusted time series data for the BNZ - BusinessNZ PSI

Services Landscape

The PSI

New Zealand’s Performance of Services Index (PSI) is not looking all that encouraging. Instead of following through on its trend clawback of recent months, it slipped a big cog in January, to 45.9.
Read more

Principal components

It wasn’t just the overall PSI that was below average in January.  This was true of all its main sub-indices too. To be fair, the Employment index, at 48.1, wasn’t all that much south of its norm of 51.4.
Read more

Industry detail

While the industry detail was mixed, it was clear which one was suffering by far the most. This was Accommodation, Cafes & Restaurants, whose index crashed to 17.9.
Read more

Other lenses

In trying to fathom why the PSI is struggling as much as it is, the recent theme of smaller firms suffering more than larger firms has been reinforced by January’s results.
Read more

Craig Ebert

Craig Ebert

Senior Economist, BNZ

Sponsor Statement

BNZ is delighted to be associated with the Performance of Services Index (PSI) and BusinessNZ.

This association brings together the significant experience of leading business advocacy body BusinessNZ, and business finance specialist BNZ.

We look forward to continuing our association with BusinessNZ and associated regional organisations, and to playing our part in the ongoing development of the New Zealand service sector.

PSI Time Series Table

The results are seasonally adjusted.

National Indicies Jan
2021
Sep
2021
Oct
2021
Nov
2021
Dec
2021
Jan
2022
BNZ – BusinessNZ PSI 49.6 46.6 45.3 47.3 49.8 45.9
Activity/Sales 48.5 43.4 44.8 46.5 50.7 44.1
Employment 46.0 51.4 50.1 50.4 49.1 48.1
New Orders/Business 55.5 47.7 47.5 53.3 52.0 41.8
Stocks/Inventories 50.0 50.6 46.2 47.1 51.0 47.6
Supplier Deliveries 41.2 41.4 37.0 37.9 49.8 43.6

BNZ – BusinessNZ PSI Time Series

January 2018 – January 2022

International Results

J.P. Morgan Global Manufacturing PSITM

06 Jan 2022
54.6

About the PSI

The BNZ – BusinessNZ Performance of Services Index is a monthly survey of the service sector providing an early indicator of activity levels.

A PSI reading above 50 points indicates service activity is expanding; below 50 indicates it is contracting.

The main PSI and sub-index results are seasonally adjusted.

Technical Contact

Stephen Summers
Economist, BusinessNZ

[email protected]

PSI Releases

Lost momentum

New Zealand’s services sector fell back into contraction during March, according to the BNZ – BusinessNZ Performance of Services Index (PSI). The PSI for March was 47.5 (A PSI reading above 50.0 indicates that the service sector is generally expanding; below 50.0 that...

Path of expansion

New Zealand’s services sector continued its path of expansion in February, according to the BNZ – BusinessNZ Performance of Services Index (PSI). The PSI for February was 53.0 (A PSI reading above 50.0 indicates that the service sector is generally expanding; below...

Green shoots?

New Zealand’s services sector climbed back into expansion for the start of 2024, according to the BNZ – BusinessNZ Performance of Services Index (PSI). The PSI for January was 52.1 (A PSI reading above 50.0 indicates that the service sector is generally expanding;...

Activity on holiday

New Zealand’s services sector fell back into contraction during December, according to the BNZ – BusinessNZ Performance of Services Index (PSI). The PSI for December was 48.8 (A PSI reading above 50.0 indicates that the service sector is generally expanding; below...

Over the line

New Zealand’s services sector recorded expansion in November, according to the BNZ – BusinessNZ Performance of Services Index (PSI). The PSI for November was 51.2 (A PSI reading above 50.0 indicates that the service sector is generally expanding; below 50.0 that it is...

BNZ – BusinessNZ
Performance of
Composite Index

46.7

GDP-Weighted Index

47.4

Free-Weighted Index

The seasonally adjusted BNZ – BusinessNZ Performance of Composite Index or PCI (which combines the PMI and PSI) saw the two options for measuring the January PCI both return to contraction.

The January GDP-Weighted Index (46.7) decreased 3.8 points from December, while the Free-Weighted Index (47.4) fell 5.3 points.

PCI Time Series Table

The results are seasonally adjusted.

National Indices Jan
2021
Sep
2021
Oct
2021
Nov
2021
Dec
2021
Jan
2022
GDP-Weighted Index 50.7 47.1 46.3 47.7 50.5 46.7
Free-Weighted Index 52.4 49.1 50.3 49.8 52.7 47.4

BNZ – BusinessNZ PCI Time Series

January 2018 – January 2022

About the PCI

The BNZ – BusinessNZ Performance of Composite Index (PCI) takes into account results from both the Performance of Manufacturing Index (PMI) and the Performance of Services Index (PSI). Combined results are shown in two ways:

GDP-Weighted Index:
Apportions the weight of the manufacturing and services index within the economy to produce an overall result.

Free-Weighted Index:
Combines data from both indexes to produce an overall result.

Both time series for the PCI are then seasonally adjusted.

BNZ - BusinessNZ PCI

Time Series Data

View seasonally adjusted and unadjusted time series data for the BNZ - BusinessNZ PCI

Our Contributors

The BNZ – BusinessNZ PSI contains data obtained through BusinessNZ’s regional organisations