BNZ – BusinessNZ
Performance of
Services Index

Easing expansion – PSI

15 Aug, 2016
54.2
July
-2.2

Monthly Change

expanding
slower rate

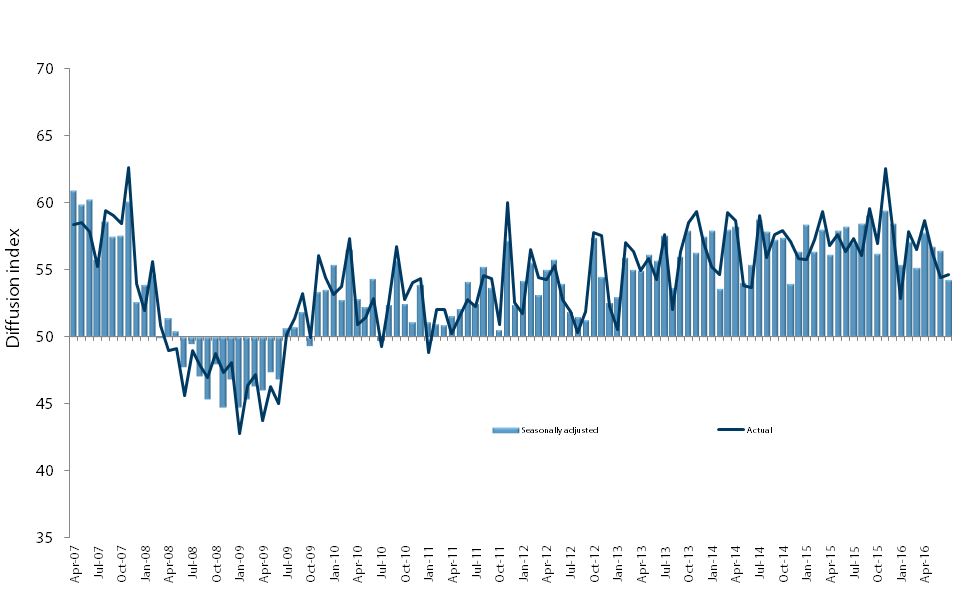
New Zealand’s services sector experienced a dip in expansion levels during July, according to the BNZ – BusinessNZ Performance of Services Index (PSI).
 
The PSI for July was 54.2.  This was 2.2 points down from June, and the lowest value since November 2014 (A PSI reading above 50.0 indicates that the service sector is generally expanding; below 50.0 that it is declining).
 
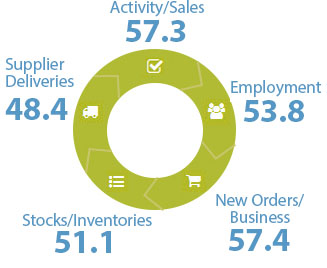
BusinessNZ chief executive Kirk Hope said that despite the dip in expansion levels for July, the primary components involving activity/sales (57.3) and new orders/business (57.4) remained very healthy.
 
“Looking at comments, the proportion of positive comments actually increased from 59.3% in June to 65.6% in July.  Also, negative comments were strongly based around seasonal factors, with both the weather and school holidays mentioned numerous times.  
 
Regarding the latest PSI and PMI results, BNZ Senior Economist Doug Steel said “With July’s PSI around about average, and the PMI holding above its norm, combined they suggest the economy is expanding at a rate around, or slightly above, trend. In numbers, this infers annual GDP growth circa 3%”.

Kirk Hope

Kirk Hope

CEO, BusinessNZ

BNZ - BusinessNZ PSI

Time Series Data

View seasonally adjusted and unadjusted time series data for the BNZ - BusinessNZ PSI

Services Landscape

Slower Service

The Performance of Services Index (PSI) dropped a couple of points in July, to a seasonally adjusted 54.2 from 56.4 in June. July’s result is the lowest since November 2014. Service sector growth seems to have slowed a bit from its recent strong run. It is something to note.
Read more  

GDP Implications

With July’s PSI around about average, and the PMI holding above its norm, combined they suggest the economy is expanding at a rate around, or slightly above, trend. In numbers, this infers annual GDP growth circa 3%.
Read more  

Accommodating

One of the industries at the forefront of New Zealand’s current GDP expansion is tourism. July’s Accommodation Survey attested to this. International guest nights were 13.7% higher than their level of a year ago. This continued the pace we’ve seen the very start of the year.
Read more  

Retail Expenditure

July’s PSI measured a bit of a slowing in its retail component (to an unadjusted index reading of 54.9). Nonetheless, it was still clearly expansive. And other indicators of retail spending remain positively upbeat.
Read more .

Doug Steel

Doug Steel

Senior Economist, BNZ

Sponsor Statement

BNZ is delighted to be associated with the Performance of Services Index (PSI) and BusinessNZ.

This association brings together the significant experience of leading business advocacy body BusinessNZ, and business finance specialist BNZ.

We look forward to continuing our association with BusinessNZ and associated regional organisations, and to playing our part in the ongoing development of the New Zealand service sector.

PSI Time Series Table

The results are seasonally adjusted.

National Indicies Jul
2015
Mar
2015
Apr
2016
May
2016
Jun
2016
Jul
2016
BNZ – BusinessNZ PSI 57.0 55.1 57.7 56.7 56.4 54.2
Activity/Sales 60.6 59.8 63.0 59.9 57.8 57.3
Employment 53.7 53.0 53.8 54.4 54.8 53.8
New Orders/Business 60.8 57.4 61.3 59.9 58.1 57.4
Stocks/Inventories 52.2 52.5 52.5 52.3 53.2 51.1
Supplier Deliveries 55.1 51.2 54.2 52.1 54.9 48.4

BNZ – BusinessNZ PSI Time Series

July 2011 – July 2015

International Results

J.P. Morgan Global Manufacturing PSITM

03 Aug 2016
51.3

About the PSI

The BNZ – BusinessNZ Performance of Services Index is a monthly survey of the service sector providing an early indicator of activity levels.

A PSI reading above 50 points indicates service activity is expanding; below 50 indicates it is contracting.

The main PSI and sub-index results are seasonally adjusted.

Technical Contact

Stephen Summers
Economist, BusinessNZ

[email protected]

PSI Releases

Struggle street

New Zealand’s services sector continued to contract further in April, according to the BNZ – BusinessNZ Performance of Services Index (PSI). The PSI for April was 47.1 (A PSI reading above 50.0 indicates that the service sector is generally expanding; below 50.0 that...

Lost momentum

New Zealand’s services sector fell back into contraction during March, according to the BNZ – BusinessNZ Performance of Services Index (PSI). The PSI for March was 47.5 (A PSI reading above 50.0 indicates that the service sector is generally expanding; below 50.0 that...

Path of expansion

New Zealand’s services sector continued its path of expansion in February, according to the BNZ – BusinessNZ Performance of Services Index (PSI). The PSI for February was 53.0 (A PSI reading above 50.0 indicates that the service sector is generally expanding; below...

Green shoots?

New Zealand’s services sector climbed back into expansion for the start of 2024, according to the BNZ – BusinessNZ Performance of Services Index (PSI). The PSI for January was 52.1 (A PSI reading above 50.0 indicates that the service sector is generally expanding;...

Activity on holiday

New Zealand’s services sector fell back into contraction during December, according to the BNZ – BusinessNZ Performance of Services Index (PSI). The PSI for December was 48.8 (A PSI reading above 50.0 indicates that the service sector is generally expanding; below...

BNZ – BusinessNZ
Performance of
Composite Index

54.5

GDP-Weighted Index

55.4

Free-Weighted Index

The seasonally adjusted BNZ – BusinessNZ Performance of Composite Index or PCI (which combines the PMI and PSI) saw the two options for measuring the PCI both experience a dip in expansion from June to July.

The July GDP-Weighted Index (54.5) decreased 2.2 points from June, while the Free-Weighted Index (55.4) decreased 1.6 points. The lower GDP-Weighted result was mainly due to a lower PSI value for July.

PCI Time Series Table

The results are seasonally adjusted.

National Indicies Jul
2015
Mar
2016
Apr
2016
May
2016
Jun
2016
Jul
2016
GDP-Weighted Index 56.7 55.1 57.7 56.7 56.7 54.5
Free-Weighted Index 56.2 55.1 57.2 57.4 57.0 55.4

BNZ – BusinessNZ PCI Time Series

July 2011 – July 2015

About the PCI

The BNZ – BusinessNZ Performance of Composite Index (PCI) takes into account results from both the Performance of Manufacturing Index (PMI) and the Performance of Services Index (PSI). Combined results are shown in two ways:

GDP-Weighted Index:
Apportions the weight of the manufacturing and services index within the economy to produce an overall result.

Free-Weighted Index:
Combines data from both indexes to produce an overall result.

Both time series for the PCI are then seasonally adjusted.

BNZ - BusinessNZ PCI

Time Series Data

View seasonally adjusted and unadjusted time series data for the BNZ - BusinessNZ PCI

Our Contributors

The BNZ – BusinessNZ PSI contains data obtained through BusinessNZ’s regional organisations