BNZ – BusinessNZ
Performance of
Services Index

Mixed results – PSI

13 Aug, 2018
55.1
July
+2.4

Monthly Change

expanding
faster rate

While New Zealand’s services sector experienced an increase in expansion levels during July, there were mixed results when looking beyond the main figure, according to the BNZ – BusinessNZ Performance of Services Index (PSI).

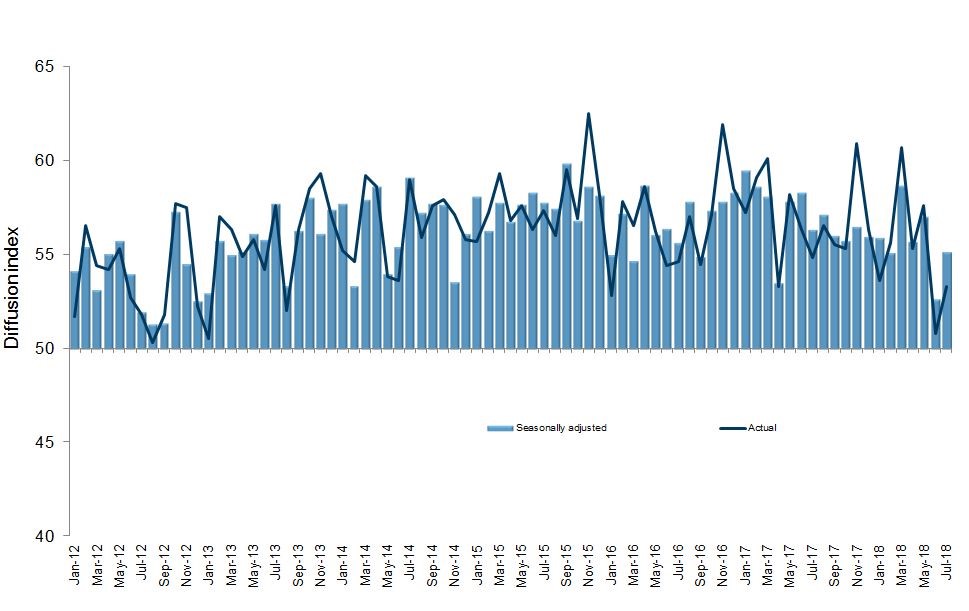
The PSI for July was 55.1, which was 2.4 points higher than June (A PSI reading above 50.0 indicates that the service sector is generally expanding; below 50.0 that it is declining).  However, it did not show a full recovery from the sizeable drop in June.

BusinessNZ chief executive Kirk Hope said that while it was good to see overall expansionary levels not dropping further, there were still elements of the July result that gives pause for thought.

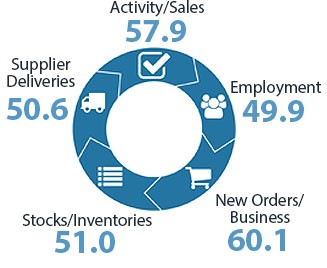
“Although the two key sub-indices of activity/sales (57.9) and new orders/business (60.1) recovered somewhat from June, the remaining three indicators remain sluggish, most notably employment (49.9) which technically fell into contraction for the first time since January 2013.  

In addition, the proportion of positive comments in July (53.8%) decreased from June (59.5%) and May (58.0%).  While some businesses noted new business opportunities, others equally noted a general slowdown and a quieter market for new customers.” 

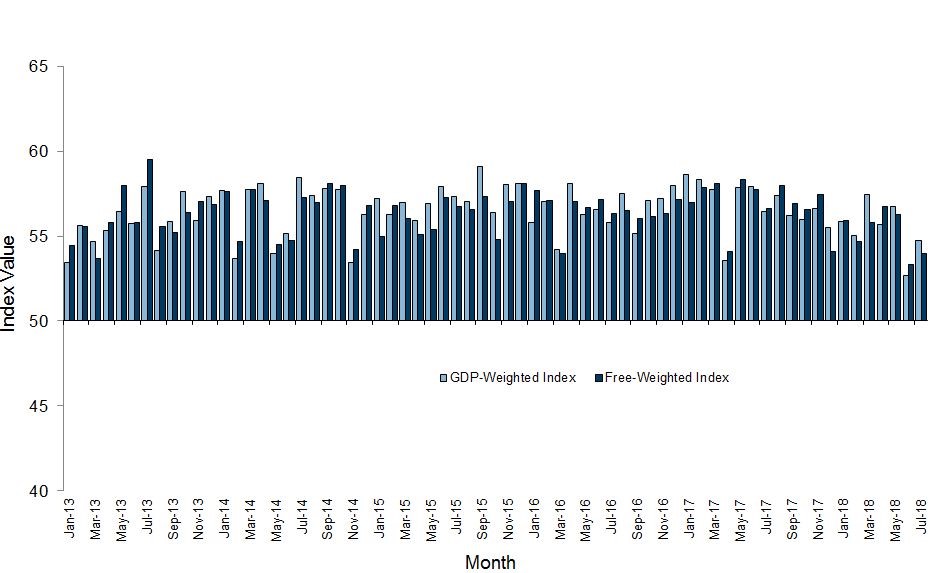
BNZ Senior Economist Doug Steel said that “the three month average has slipped to 54.9, which is the lowest it has been this year and lower than last year’s average of 56.9”.

Kirk Hope

Kirk Hope

CEO, BusinessNZ

BNZ - BusinessNZ PSI

Time Series Data

View seasonally adjusted and unadjusted time series data for the BNZ - BusinessNZ PSI

Services Landscape

Boing

The Performance of Services Index (PSI) has bounced firmly in July, from a sharp lurch lower in June. This is good to see, especially in the context of a further weakening last week in its sister survey for the manufacturing sector (PMI).
Read more

Glass Half Full

Despite the signs of slowing growth above, it is important to recognise that the PSI is not outright weak. Indeed, at 55.1 it sits above its long term average of 54.5.
Read more

Industries Mixed

PSI industry performance was mixed in July, albeit with more positives than negatives. There was ongoing strength in accommodation, cafes, and restaurants that ties in with the persistent growth in tourist numbers we have witnessed as well as a good start to the ski season.
Read more

Employment Flat

Employment was one genuinely softer spot in the PSI, coming in at 49.9 essentially unchanged from June’s 50.0.
Read more

Doug Steel

Doug Steel

Senior Economist, BNZ

Sponsor Statement

BNZ is delighted to be associated with the Performance of Services Index (PSI) and BusinessNZ.

This association brings together the significant experience of leading business advocacy body BusinessNZ, and business finance specialist BNZ.

We look forward to continuing our association with BusinessNZ and associated regional organisations, and to playing our part in the ongoing development of the New Zealand service sector.

PSI Time Series Table

The results are seasonally adjusted.

National Indicies Jul
2017
Mar
2018
Apr
2018
May
2018
Jun
2018
Jul
2018
BNZ – BusinessNZ PSI 56.3 58.7 55.7 57.0 52.7 55.1
Activity/Sales 55.4 64.7 56.3 58.1 54.9 57.9
Employment 54.8 50.7 51.5 53.1 50.0 49.9
New Orders/Business 60.6 63.6 60.7 64.0 58.5 60.1
Stocks/Inventories 53.1 55.3 51.7 54.2 50.7 51.0
Supplier Deliveries 52.5 55.4 50.9 53.0 48.1 50.6

BNZ – BusinessNZ PSI Time Series

July 2014 – July 2018

International Results

J.P. Morgan Global Manufacturing PSITM

03 Aug 2018
54.0

About the PSI

The BNZ – BusinessNZ Performance of Services Index is a monthly survey of the service sector providing an early indicator of activity levels.

A PSI reading above 50 points indicates service activity is expanding; below 50 indicates it is contracting.

The main PSI and sub-index results are seasonally adjusted.

Technical Contact

Stephen Summers
Economist, BusinessNZ

[email protected]

PSI Releases

Lost momentum

New Zealand’s services sector fell back into contraction during March, according to the BNZ – BusinessNZ Performance of Services Index (PSI). The PSI for March was 47.5 (A PSI reading above 50.0 indicates that the service sector is generally expanding; below 50.0 that...

Path of expansion

New Zealand’s services sector continued its path of expansion in February, according to the BNZ – BusinessNZ Performance of Services Index (PSI). The PSI for February was 53.0 (A PSI reading above 50.0 indicates that the service sector is generally expanding; below...

Green shoots?

New Zealand’s services sector climbed back into expansion for the start of 2024, according to the BNZ – BusinessNZ Performance of Services Index (PSI). The PSI for January was 52.1 (A PSI reading above 50.0 indicates that the service sector is generally expanding;...

Activity on holiday

New Zealand’s services sector fell back into contraction during December, according to the BNZ – BusinessNZ Performance of Services Index (PSI). The PSI for December was 48.8 (A PSI reading above 50.0 indicates that the service sector is generally expanding; below...

Over the line

New Zealand’s services sector recorded expansion in November, according to the BNZ – BusinessNZ Performance of Services Index (PSI). The PSI for November was 51.2 (A PSI reading above 50.0 indicates that the service sector is generally expanding; below 50.0 that it is...

BNZ – BusinessNZ
Performance of
Composite Index

54.8

GDP-Weighted Index

54.0

Free-Weighted Index

The seasonally adjusted BNZ – BusinessNZ Performance of Composite Index or PCI (which combines the PMI and PSI) saw the two options for measuring the PCI both display improvement in expansion during July.

The July GDP-Weighted Index (54.8) increased 2.1 points from the previous month, while the Free-Weighted Index (54.0) rose 0.7 points.  The stronger increase in the former was due to a part recovery in the services sector, while an improvement in the latter was brought back by lower expansion in the manufacturing sector.

PCI Time Series Table

The results are seasonally adjusted.

National Indicies Jul
2017
Mar
2018
Apr
2018
May
2018
Jun
2018
Jul
2018
GDP-Weighted Index 56.4 57.5 55.7 56.7 52.7 54.8
Free-Weighted Index 56.6 55.8 56.7 56.3 53.3 54.0

BNZ – BusinessNZ PCI Time Series

July 2014 – July 2018

About the PCI

The BNZ – BusinessNZ Performance of Composite Index (PCI) takes into account results from both the Performance of Manufacturing Index (PMI) and the Performance of Services Index (PSI). Combined results are shown in two ways:

GDP-Weighted Index:
Apportions the weight of the manufacturing and services index within the economy to produce an overall result.

Free-Weighted Index:
Combines data from both indexes to produce an overall result.

Both time series for the PCI are then seasonally adjusted.

BNZ - BusinessNZ PCI

Time Series Data

View seasonally adjusted and unadjusted time series data for the BNZ - BusinessNZ PCI

Our Contributors

The BNZ – BusinessNZ PSI contains data obtained through BusinessNZ’s regional organisations