BNZ – BusinessNZ
Performance of
Services Index

New orders/business boosts service sector activity for August – PSI

21 Sep, 2009

The service sector continued on its road to recovery as the August result provided the first consecutive monthly expansion since early 2008, according to the BNZ Capital – BusinessNZ Performance of Services Index (PSI).

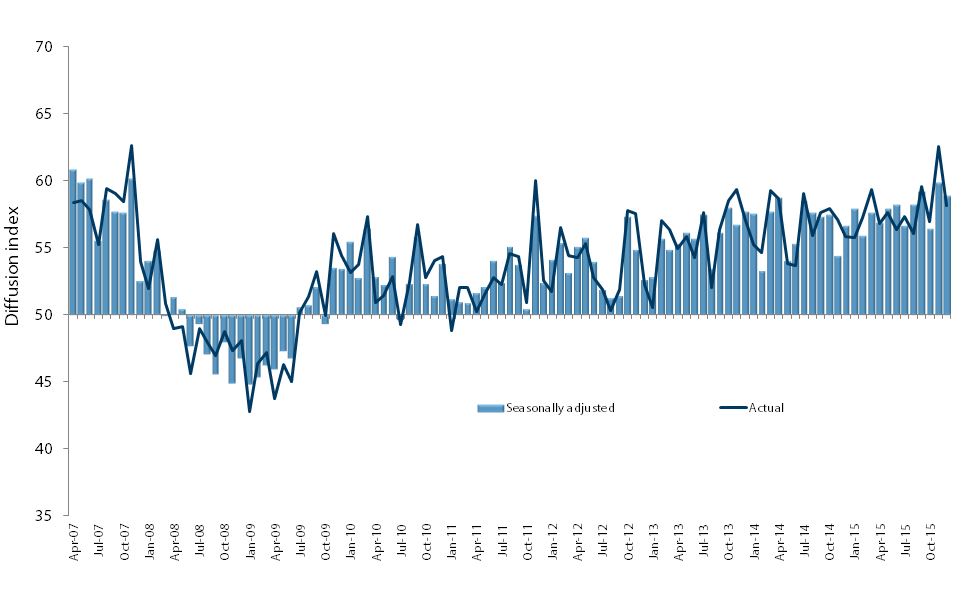
The PSI for August stood at 51.3, which was 1.2 points up from July. In comparison with previous years, the August result was 3.4 points up from August 2008, but still 8.1 points down from 2007. A PSI reading above 50.0 indicates that the service sector is generally expanding; below 50.0 that it is declining. The average PSI value for 2007 was 58.1, while for 2008 it was 49.1. So far for 2009, the average score has been 46.6.

BusinessNZ Chief Executive Phil O’Reilly said the results were positive for two reasons. The first being the historic low point of 43.7 in April looks well and truly over as new orders/business has been particularly strong over July and August. Although this is still not at the level experienced during 2007, it is quickly heading in the right direction.

“Second, the New Zealand result is mirroring offshore developments, with the JP Morgan global PSI for August (50.5) showing expansion for the first time since May 2008. Part of this global recovery has also come from a significant improvement in new orders and activity/sales.”

BNZ Capital Head of Research Stephen Toplis said the services sector has stayed positive thanks to “a jump in dairy prices, and active Government and heaps of Aussies” coming to our shores for winter holidays.

However, he added that “the data come with a health warning that hard evidence of a recovery is now going to be needed to keep confidence headed in the right direction,” yet he believes “the recession is done and dusted, that activity levels have now stabilised, and a genuine pick up is set in place for calendar 2010.

“The PSI is mimicking other indices in suggesting that even the laggard labour market is staring to show signs of life. Added to this, August saw the first serious recorded jump in dairy commodity prices after a long string of heartbreaking falls.”

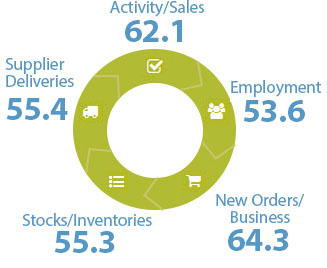
Only two of the five diffusion indices that make up the PSI exhibited expansion during August, but one of the key indicators involving new orders/business (57.6) built on its strong gains in July to exhibit its highest result since February 2008. Activity/sales (50.5) fell 1.2 points from the previous month, but still remained in positive territory. Employment (49.3) continued to show improvement with its highest level since November 2008, while stocks/inventories (48.0) rose significantly from July. Deliveries (47.9) continued to pick up from an historic low in June, as well as being the highest value since March 2009.

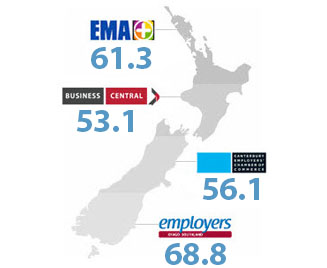
Activity was positive in all of the four main regions during August, with the strongest activity levels in the South Island. The Northern region (50.2) slipped 1 point from July, although remained in positive territory and the first time since January/February 2008 that it recorded consecutive monthly expansion. The Central region (51.6) showed expansion for the first time since January 2009, and climbed out of the June/July results which were historic lows. Both the Canterbury/Westland (53.9) and Otago/Southland (58.0) regions improved from July, with the later experiencing its first level of expansion since December 2008, and its highest level since February 2008.

Click here to view the August PSI & PCI
Click here to view the PSI time series data
Click here to view the PCI time series data

For media comment: Stephanie Moakes, ph 04 496 6554, or 021 959 831
Stephen Topliss ph 04 474 6905

BNZ - BusinessNZ PSI

Time Series Data

View seasonally adjusted and unadjusted time series data for the BNZ - BusinessNZ PSI

Services Landscape

Sponsor Statement

BNZ is delighted to be associated with the Performance of Services Index (PSI) and BusinessNZ.

This association brings together the significant experience of leading business advocacy body BusinessNZ, and business finance specialist BNZ.

We look forward to continuing our association with BusinessNZ and associated regional organisations, and to playing our part in the ongoing development of the New Zealand service sector.

PSI Time Series Table

The results are seasonally adjusted.

BNZ – BusinessNZ PSI Time Series

January 1966 – January 1970

International Results

J.P. Morgan Global Manufacturing PSITM

About the PSI

The BNZ – BusinessNZ Performance of Services Index is a monthly survey of the service sector providing an early indicator of activity levels.

A PSI reading above 50 points indicates service activity is expanding; below 50 indicates it is contracting.

The main PSI and sub-index results are seasonally adjusted.

Technical Contact

Stephen Summers
Economist, BusinessNZ

[email protected]

PSI Releases

Struggle street

New Zealand’s services sector continued to contract further in April, according to the BNZ – BusinessNZ Performance of Services Index (PSI). The PSI for April was 47.1 (A PSI reading above 50.0 indicates that the service sector is generally expanding; below 50.0 that...

Lost momentum

New Zealand’s services sector fell back into contraction during March, according to the BNZ – BusinessNZ Performance of Services Index (PSI). The PSI for March was 47.5 (A PSI reading above 50.0 indicates that the service sector is generally expanding; below 50.0 that...

Path of expansion

New Zealand’s services sector continued its path of expansion in February, according to the BNZ – BusinessNZ Performance of Services Index (PSI). The PSI for February was 53.0 (A PSI reading above 50.0 indicates that the service sector is generally expanding; below...

Green shoots?

New Zealand’s services sector climbed back into expansion for the start of 2024, according to the BNZ – BusinessNZ Performance of Services Index (PSI). The PSI for January was 52.1 (A PSI reading above 50.0 indicates that the service sector is generally expanding;...

Activity on holiday

New Zealand’s services sector fell back into contraction during December, according to the BNZ – BusinessNZ Performance of Services Index (PSI). The PSI for December was 48.8 (A PSI reading above 50.0 indicates that the service sector is generally expanding; below...

BNZ – BusinessNZ
Performance of
Composite Index

PCI Time Series Table

The results are seasonally adjusted.

BNZ – BusinessNZ PCI Time Series

January 1966 – January 1970

About the PCI

The BNZ – BusinessNZ Performance of Composite Index (PCI) takes into account results from both the Performance of Manufacturing Index (PMI) and the Performance of Services Index (PSI). Combined results are shown in two ways:

GDP-Weighted Index:
Apportions the weight of the manufacturing and services index within the economy to produce an overall result.

Free-Weighted Index:
Combines data from both indexes to produce an overall result.

Both time series for the PCI are then seasonally adjusted.

BNZ - BusinessNZ PCI

Time Series Data

View seasonally adjusted and unadjusted time series data for the BNZ - BusinessNZ PCI

Our Contributors

The BNZ – BusinessNZ PSI contains data obtained through BusinessNZ’s regional organisations