BNZ – BusinessNZ
Performance of
Services Index

Onwards and upwards – PSI

19 Jul, 2021
58.6
June
+2.3

Monthly Change

expanding
faster rate

New Zealand’s services sector was in expansion mode for the fourth consecutive month, according to the BNZ – BusinessNZ Performance of Services Index (PSI).

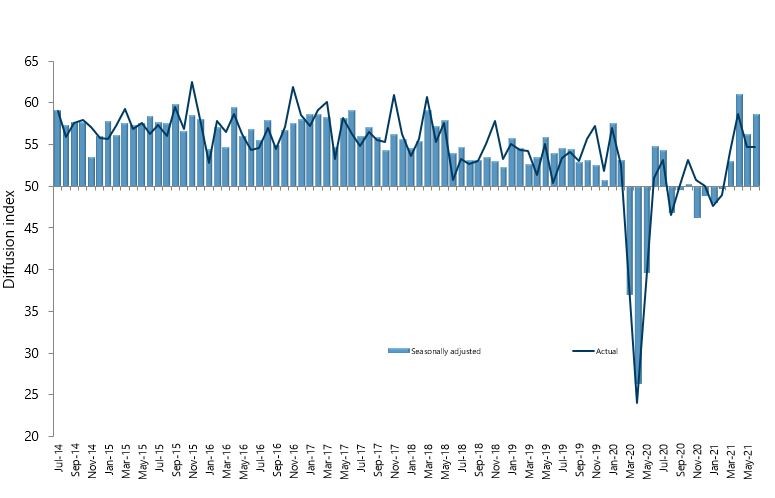
The PSI for June was 58.6 (A PSI reading above 50.0 indicates that the service sector is generally expanding; below 50.0 that it is declining).  This was 2.3 points up from May, but still below its highest ever result of 61.1 in April.

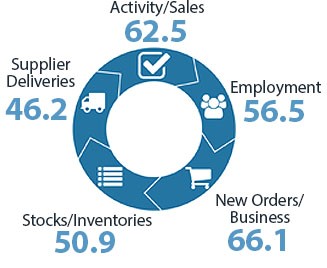
BusinessNZ chief executive Kirk Hope said that the sector experienced a boost in expansion after a lift in the key sub-indices of Activity/Sales (62.5) and New Orders/Business (66.1).

“While the key indicators show very healthy expansion, comments from respondents were very similar to its sister survey the PMI, highlighting staff/skills shortages and general logistics issues.”

BNZ Senior Economist Craig Ebert said that “combined, the PSI and PMI signal a hefty rate of growth in economic activity – in the realm of a 4% annual rate of growth in GDP. At one level, this is very encouraging. At another, it suggests the economy is running headlong into even-worse capacity constraint, and, with it, serious inflation pressure.”

Kirk Hope

Kirk Hope

CEO, BusinessNZ

BNZ - BusinessNZ PSI

Time Series Data

View seasonally adjusted and unadjusted time series data for the BNZ - BusinessNZ PSI

Services Landscape

The PSI

In the space of three months, the Performance of Services Index (PSI) has gone from indicating scant growth to rapid expansion. In printing at 58.6 in June, the PSI established a June quarter average of 58.7. This compares to the average over the March quarter of 50.2.
Read more

Employment plus

Certainly, much of the negatively headed feedback to the PSI survey in June related to ongoing problems with supplies, including increased lead times. Complaints also resonated regarding the scarcity of staff, with the closed borders partly to blame.
Read more

Industry features

While the PSI is riding high overall, there is still interesting variability in its detail. Two of the strongest industries in June, for instance, were Property & Business (57.3) and Finance & Insurance (55.0).
Read more

GDP inferences

But, really, it’s the now very strong force of the PSI, overall, that’s the important thing to note. Even stronger in June, of course, was the Performance of Manufacturing Index (PMI), which hit 60.7.
Read more

Craig Ebert

Craig Ebert

Senior Economist, BNZ

Sponsor Statement

BNZ is delighted to be associated with the Performance of Services Index (PSI) and BusinessNZ.

This association brings together the significant experience of leading business advocacy body BusinessNZ, and business finance specialist BNZ.

We look forward to continuing our association with BusinessNZ and associated regional organisations, and to playing our part in the ongoing development of the New Zealand service sector.

PSI Time Series Table

The results are seasonally adjusted.

National Indicies Jun
2020
Feb
2021
Mar
2021
Apr
2021
May
2021
Jun
2021
BNZ – BusinessNZ PSI 54.8 49.7 53.0 61.1 56.3 58.6
Activity/Sales 58.9 51.8 55.8 62.0 59.0 62.5
Employment 45.5 51.4 52.2 60.9 54.5 56.5
New Orders/Business 61.1 49.8 58.6 67.1 62.7 66.1
Stocks/Inventories 51.8 50.1 50.6 55.0 51.4 50.9
Supplier Deliveries 53.2 42.3 44.4 47.0 45.2 46.2

BNZ – BusinessNZ PSI Time Series

June 2017 – June 2021

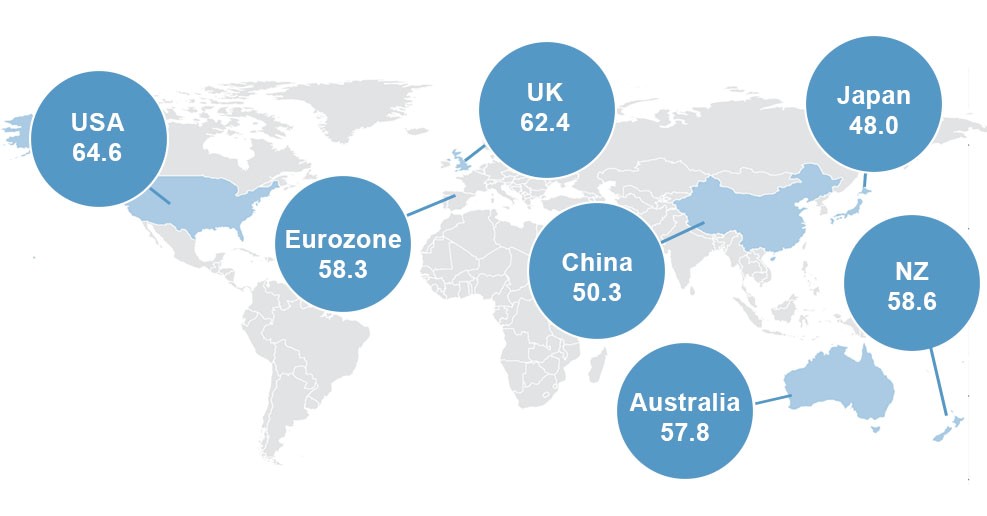
International Results

J.P. Morgan Global Manufacturing PSITM

07 Jul 2021
57.5

About the PSI

The BNZ – BusinessNZ Performance of Services Index is a monthly survey of the service sector providing an early indicator of activity levels.

A PSI reading above 50 points indicates service activity is expanding; below 50 indicates it is contracting.

The main PSI and sub-index results are seasonally adjusted.

Technical Contact

Stephen Summers
Economist, BusinessNZ

[email protected]

PSI Releases

Stuck in a rut

New Zealand’s services sector result for October remained in contraction, according to the BNZ – BusinessNZ Performance of Services Index (PSI). The PSI for October was 46.0 (A PSI reading above 50.0 indicates that the service sector is generally expanding; below 50.0...

Same same

September's result for New Zealand’s services sector remained the same as August, although still firmly in contraction mode, according to the BNZ – BusinessNZ Performance of Services Index (PSI). The PSI for September was 45.7 (A PSI reading above 50.0 indicates that...

Slow crawl

Activity in New Zealand’s services sector inched its way higher during August, although still firmly in contraction territory, according to the BNZ – BusinessNZ Performance of Services Index (PSI). The PSI for August was 45.5 (A PSI reading above 50.0 indicates that...

Relative progress

Activity in New Zealand’s services sector for July showed some improvement after a horrendous June result, according to the BNZ – BusinessNZ Performance of Services Index (PSI). The PSI for July was 44.6 (A PSI reading above 50.0 indicates that the service sector is...

Sinking

Activity in New Zealand’s services sector sunk even further during June, according to the BNZ – BusinessNZ Performance of Services Index (PSI). The PSI for June was 40.2 (A PSI reading above 50.0 indicates that the service sector is generally expanding; below 50.0...

BNZ – BusinessNZ
Performance of
Composite Index

59.1

GDP-Weighted Index

60.3

Free-Weighted Index

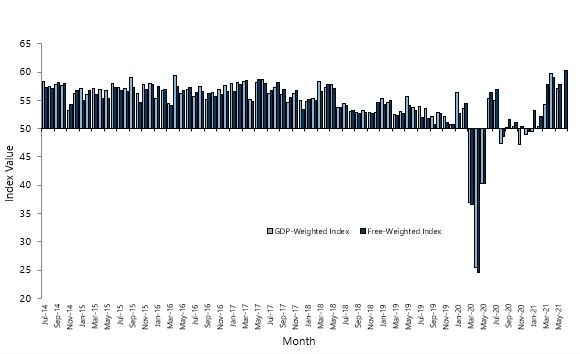
The seasonally adjusted BNZ – BusinessNZ Performance of Composite Index or PCI (which combines the PMI and PSI) saw the two options for measuring the PCI show higher levels of expansion for June.

The June GDP-Weighted Index (59.1) increased 2.0 points from May, while the Free-Weighted Index (60.3) rose 2.5 points.

PCI Time Series Table

The results are seasonally adjusted.

National Indices Jun
2020
Feb
2021
Mar
2021
Apr
2021
May
2021
Jun
2021
GDP-Weighted Index 55.3 50.4 54.3 59.8 57.1 59.1
Free-Weighted Index 56.4 52.1 57.8 59.0 57.8 60.3

BNZ – BusinessNZ PCI Time Series

June 2017 – June 2021

About the PCI

The BNZ – BusinessNZ Performance of Composite Index (PCI) takes into account results from both the Performance of Manufacturing Index (PMI) and the Performance of Services Index (PSI). Combined results are shown in two ways:

GDP-Weighted Index:
Apportions the weight of the manufacturing and services index within the economy to produce an overall result.

Free-Weighted Index:
Combines data from both indexes to produce an overall result.

Both time series for the PCI are then seasonally adjusted.

BNZ - BusinessNZ PCI

Time Series Data

View seasonally adjusted and unadjusted time series data for the BNZ - BusinessNZ PCI

Our Contributors

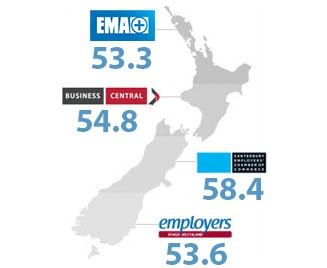
The BNZ – BusinessNZ PSI contains data obtained through BusinessNZ’s regional organisations