BNZ – BusinessNZ
Performance of
Services Index

Seasonal adjustment – PSI

16 Jul, 2018
52.8
June
-4.3

Monthly Change

expanding
slower rate

New Zealand’s services sector experienced a decrease in expansion levels during June, according to the BNZ – BusinessNZ Performance of Services Index (PSI).

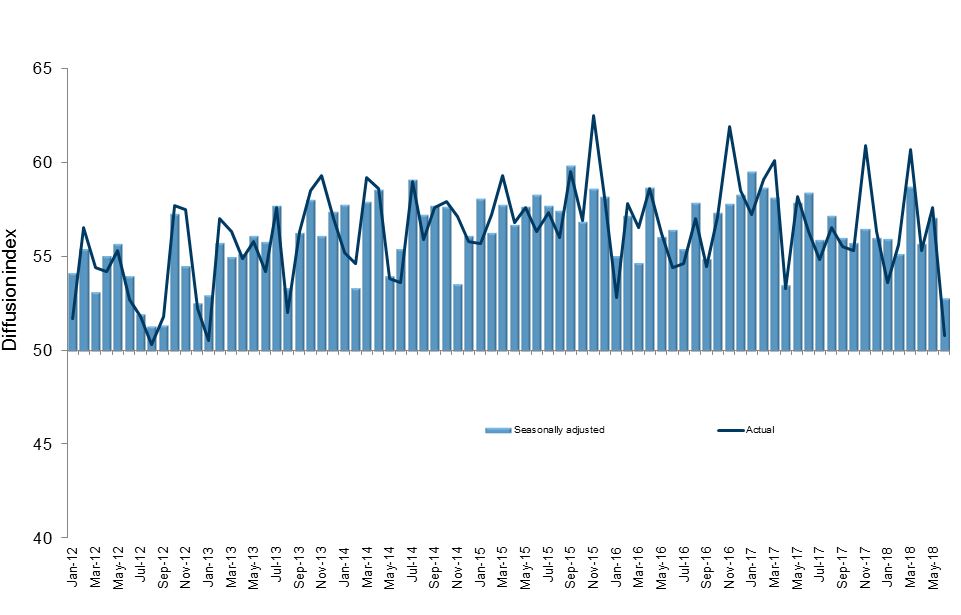
The PSI for June was 52.8, which was 4.3 points lower than May (A PSI reading above 50.0 indicates that the service sector is generally expanding; below 50.0 that it is declining).  It was also the lowest level of expansion since December 2012.

BusinessNZ chief executive Kirk Hope said that the components that make up the overall PSI result all experienced a noticeable drop in expansion levels.
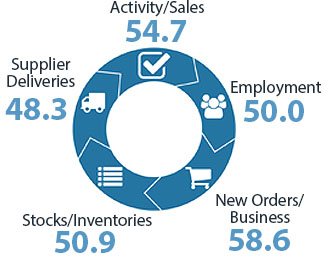
“The key sub-indexes of activity/sales (54.7) and new orders/business (58.6) slowed in June, with the latter recording its lowest figure since April 2017.  In addition, employment (50.0) was at the no change level, and the lowest result since January 2013.

Interestingly, the proportion of positive comments in June (59.5%) was slightly up on May (58.0%), although given the sector is still showing expansion a swing to negative comments dominating would have been surprising.  All up, a PSI result that is at its lowest level for around five and a half years means the next few months will be watched closely for further signs of a slowdown”. 

BNZ Senior Economist Doug Steel said that “while some have discounted weak business confidence readings of late, the PSI and PMI results are not so easily dismissed as these are surveys of business outcomes not based on sentiment, outlooks, or expectations. In this sense, they are arguably more worrying from a growth perspective”.

Kirk Hope

Kirk Hope

CEO, BusinessNZ

BNZ - BusinessNZ PSI

Time Series Data

View seasonally adjusted and unadjusted time series data for the BNZ - BusinessNZ PSI

Services Landscape

Stumble

There was so much to like in May’s Performance of Services Index (PSI). Fast forward a month and there now seems much to fret about.
Read more

Growth Warning Signal?

May strength followed by June weakness could just be monthly noise rather than a pointer to a sustained period of slower growth. But we are wary of dismissing June’s weakness out of hand, given the PSI is not usually that volatile and the weaker result echoes last week’s softer Performance of Manufacturing Index (PMI).
Read more

Pockets of Strength

The general weakness in June’s PSI is seen in seven of the ten industry groups recording a lower reading this year compared to last. But there were some pockets of strength.
Read more

Doug Steel

Doug Steel

Senior Economist, BNZ

Sponsor Statement

BNZ is delighted to be associated with the Performance of Services Index (PSI) and BusinessNZ.

This association brings together the significant experience of leading business advocacy body BusinessNZ, and business finance specialist BNZ.

We look forward to continuing our association with BusinessNZ and associated regional organisations, and to playing our part in the ongoing development of the New Zealand service sector.

PSI Time Series Table

The results are seasonally adjusted.

National Indicies June
2017
Feb
2018
Mar
2018
Apr
2018
May
2018
June
2018
BNZ – BusinessNZ PSI 58.4 55.2 58.7 55.7 57.1 52.8
Activity/Sales 59.7 53.7 64.8 56.2 57.9 54.7
Employment 53.9 50.8 50.7 51.5 53.0 50.0
New Orders/Business 64.4 60.9 63.6 60.8 64.1 58.6
Stocks/Inventories 55.4 54.3 55.4 51.8 54.4 50.9
Supplier Deliveries 57.7 54.5 55.5 51.0 53.1 48.3

BNZ – BusinessNZ PSI Time Series

June 2014 – June 2018

International Results

J.P. Morgan Global Manufacturing PSITM

05 Jul 2018
54.6

About the PSI

The BNZ – BusinessNZ Performance of Services Index is a monthly survey of the service sector providing an early indicator of activity levels.

A PSI reading above 50 points indicates service activity is expanding; below 50 indicates it is contracting.

The main PSI and sub-index results are seasonally adjusted.

Technical Contact

Stephen Summers
Economist, BusinessNZ

[email protected]

PSI Releases

Lost momentum

New Zealand’s services sector fell back into contraction during March, according to the BNZ – BusinessNZ Performance of Services Index (PSI). The PSI for March was 47.5 (A PSI reading above 50.0 indicates that the service sector is generally expanding; below 50.0 that...

Path of expansion

New Zealand’s services sector continued its path of expansion in February, according to the BNZ – BusinessNZ Performance of Services Index (PSI). The PSI for February was 53.0 (A PSI reading above 50.0 indicates that the service sector is generally expanding; below...

Green shoots?

New Zealand’s services sector climbed back into expansion for the start of 2024, according to the BNZ – BusinessNZ Performance of Services Index (PSI). The PSI for January was 52.1 (A PSI reading above 50.0 indicates that the service sector is generally expanding;...

Activity on holiday

New Zealand’s services sector fell back into contraction during December, according to the BNZ – BusinessNZ Performance of Services Index (PSI). The PSI for December was 48.8 (A PSI reading above 50.0 indicates that the service sector is generally expanding; below...

Over the line

New Zealand’s services sector recorded expansion in November, according to the BNZ – BusinessNZ Performance of Services Index (PSI). The PSI for November was 51.2 (A PSI reading above 50.0 indicates that the service sector is generally expanding; below 50.0 that it is...

BNZ – BusinessNZ
Performance of
Composite Index

52.7

GDP-Weighted Index

53.1

Free-Weighted Index

The seasonally adjusted BNZ – BusinessNZ Performance of Composite Index or PCI (which combines the PMI and PSI) saw the two options for measuring the PCI both display a decrease in expansion during June.

The June GDP-Weighted Index (52.7) decreased 4.2 points from the previous month, while the Free-Weighted Index (53.1) fell 3.4 points.  The decrease in both was expected given the services and manufacturing sectors both displayed lower expansion during June.

PCI Time Series Table

The results are seasonally adjusted.

National Indicies Jun
2017
Feb
2018
Mar
2018
Apr
2018
May
2018
June
2018
GDP-Weighted Index 58.0 55.1 57.6 55.8 56.9 52.7
Free-Weighted Index 57.5 54.7 55.8 56.9 56.5 53.1

BNZ – BusinessNZ PCI Time Series

June 2014 – June 2018

About the PCI

The BNZ – BusinessNZ Performance of Composite Index (PCI) takes into account results from both the Performance of Manufacturing Index (PMI) and the Performance of Services Index (PSI). Combined results are shown in two ways:

GDP-Weighted Index:
Apportions the weight of the manufacturing and services index within the economy to produce an overall result.

Free-Weighted Index:
Combines data from both indexes to produce an overall result.

Both time series for the PCI are then seasonally adjusted.

BNZ - BusinessNZ PCI

Time Series Data

View seasonally adjusted and unadjusted time series data for the BNZ - BusinessNZ PCI

Our Contributors

The BNZ – BusinessNZ PSI contains data obtained through BusinessNZ’s regional organisations