BNZ – BusinessNZ
Performance of
Services Index

Service with a smile – PSI

17 Feb, 2020
57.1
January
+5.0

Monthly Change

expanding
faster rate

New Zealand’s services sector started the year on a pleasing note, according to the BNZ – BusinessNZ Performance of Services Index (PSI).

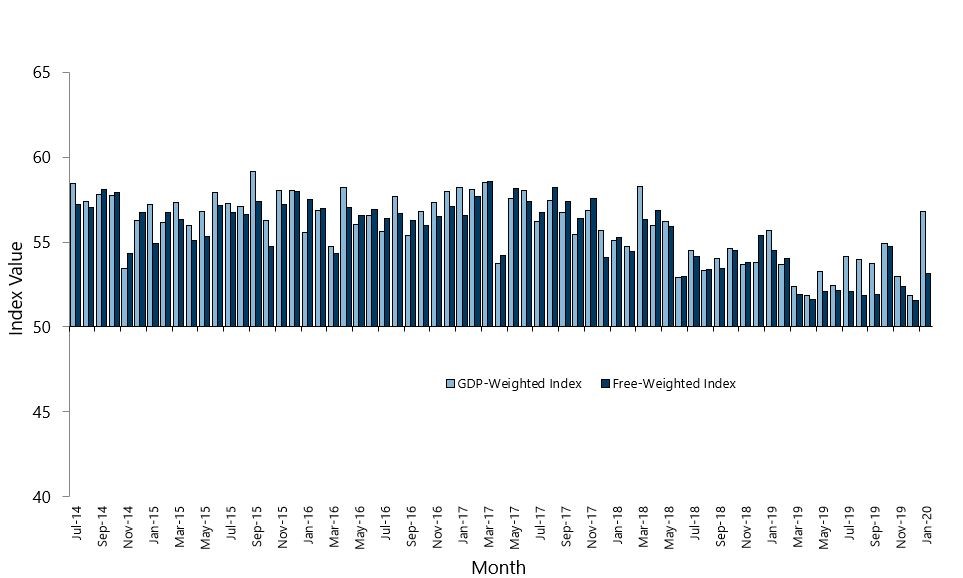
The PSI for January was 57.1, which was 5 points up from December (A PSI reading above 50.0 indicates that the service sector is generally expanding; below 50.0 that it is declining). The January result was also the highest level of expansion since March 2018, and clear above the long term average of 54.4 for the survey.

BusinessNZ chief executive Kirk Hope said that the pick-up in activity for the first month of 2020 was welcome after a lacklustre 2019.

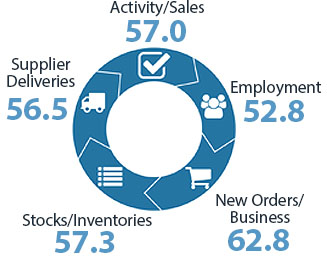
“The key drivers of the January result was a combination of new orders (62.8) getting back over the 60-point mark, as well as activity/sales (57.0) lifting to its highest level since January 2019. Supplier deliveries (56.5) also saw its strongest result since June 2017.”

“Any continuation of January’s result in the months ahead will depend on new business opportunities and consistent sales to drive activity further.”

BNZ Senior Economist Doug Steel said that “for now, January’s glowing PSI report fits with the rather upbeat view of the economy expressed by the Reserve Bank last week. In the least, it helps offset a still soft looking PMI. Regardless, the near term outlook heavily depends on how much – and for how long – disruption occurs as a result of local weather conditions and COVID-19”.

Kirk Hope

Kirk Hope

CEO, BusinessNZ

BNZ - BusinessNZ PSI

Time Series Data

View seasonally adjusted and unadjusted time series data for the BNZ - BusinessNZ PSI

Services Landscape

Happy New Year!

We thought it was probably too early for any impact from COVID-19 and policy response to it to materially show up in the January Performance of Services Index (PSI). After all, general awareness of the virus didn’t really ramp up until very late in the month.
Read more

Positives Abound

This puts the PSI firmly above its long term average of 54.4, having been wallowing a bit below it late last year. The details oozed strength too.
Read more

Near Term Caution

But for all the strength in January’s survey, one has to remain a little cautious on what is happening underfoot. For a start, and most obviously, parts of the service sector can be expected to take a hit from COVID-19 and responses to it, at least in the short term.
Read more

Doug Steel

Doug Steel

Senior Economist, BNZ

Sponsor Statement

BNZ is delighted to be associated with the Performance of Services Index (PSI) and BusinessNZ.

This association brings together the significant experience of leading business advocacy body BusinessNZ, and business finance specialist BNZ.

We look forward to continuing our association with BusinessNZ and associated regional organisations, and to playing our part in the ongoing development of the New Zealand service sector.

PSI Time Series Table

The results are seasonally adjusted.

National Indicies Jan
2019
Sep
2019
Oct
2019
Nov
2019
Dec
2019
Jan
2020
BNZ – BusinessNZ PSI 55.4 54.5 55.3 53.2 52.1 57.1
Activity/Sales 61.2 54.4 57.9 54.1 52.8 57.0
Employment 52.3 52.6 51.5 51.6 52.4 52.8
New Orders/Business 58.7 59.3 62.2 53.6 55.2 62.8
Stocks/Inventories 48.7 51.4 51.5 58.6 52.0 57.3
Supplier Deliveries 51.1 50.6 49.8 52.9 48.2 56.5

BNZ – BusinessNZ PSI Time Series

January 2016 – January 2020

International Results

J.P. Morgan Global Manufacturing PSITM

05 Feb 2020
52.7

About the PSI

The BNZ – BusinessNZ Performance of Services Index is a monthly survey of the service sector providing an early indicator of activity levels.

A PSI reading above 50 points indicates service activity is expanding; below 50 indicates it is contracting.

The main PSI and sub-index results are seasonally adjusted.

Technical Contact

Stephen Summers
Economist, BusinessNZ

[email protected]

PSI Releases

Lost momentum

New Zealand’s services sector fell back into contraction during March, according to the BNZ – BusinessNZ Performance of Services Index (PSI). The PSI for March was 47.5 (A PSI reading above 50.0 indicates that the service sector is generally expanding; below 50.0 that...

Path of expansion

New Zealand’s services sector continued its path of expansion in February, according to the BNZ – BusinessNZ Performance of Services Index (PSI). The PSI for February was 53.0 (A PSI reading above 50.0 indicates that the service sector is generally expanding; below...

Green shoots?

New Zealand’s services sector climbed back into expansion for the start of 2024, according to the BNZ – BusinessNZ Performance of Services Index (PSI). The PSI for January was 52.1 (A PSI reading above 50.0 indicates that the service sector is generally expanding;...

Activity on holiday

New Zealand’s services sector fell back into contraction during December, according to the BNZ – BusinessNZ Performance of Services Index (PSI). The PSI for December was 48.8 (A PSI reading above 50.0 indicates that the service sector is generally expanding; below...

Over the line

New Zealand’s services sector recorded expansion in November, according to the BNZ – BusinessNZ Performance of Services Index (PSI). The PSI for November was 51.2 (A PSI reading above 50.0 indicates that the service sector is generally expanding; below 50.0 that it is...

BNZ – BusinessNZ
Performance of
Composite Index

56.8

GDP-Weighted Index

53.1

Free-Weighted Index

The seasonally adjusted BNZ – BusinessNZ Performance of Composite Index or PCI (which combines the PMI and PSI) saw the two options for measuring the PCI both increase from the previous month.

The January GDP-Weighted Index (56.8) increased 4.9 points from December, while the Free-Weighted Index (53.1) rose 1.5 points.  The fact that the services sector displayed much stronger levels of activity in January caused the GDP-Weighted Index to produce a much higher result – the highest since March 2018.

PCI Time Series Table

The results are seasonally adjusted.

National Indices Jan
2019
Sep
2019
Oct
2019
Nov
2019
Dec
2019
Jan
2020
GDP-Weighted Index 55.7 53.7 54.9 53.0 51.9 56.8
Free-Weighted Index 54.5 51.9 54.8 52.4 51.6 53.1

BNZ – BusinessNZ PCI Time Series

January 2016 – January 2020

About the PCI

The BNZ – BusinessNZ Performance of Composite Index (PCI) takes into account results from both the Performance of Manufacturing Index (PMI) and the Performance of Services Index (PSI). Combined results are shown in two ways:

GDP-Weighted Index:
Apportions the weight of the manufacturing and services index within the economy to produce an overall result.

Free-Weighted Index:
Combines data from both indexes to produce an overall result.

Both time series for the PCI are then seasonally adjusted.

BNZ - BusinessNZ PCI

Time Series Data

View seasonally adjusted and unadjusted time series data for the BNZ - BusinessNZ PCI

Our Contributors

The BNZ – BusinessNZ PSI contains data obtained through BusinessNZ’s regional organisations