BNZ – BusinessNZ
Performance of
Services Index

Services sector drop

15 May, 2023
49.8
April
-4.0

Monthly Change

Contracting
Previously Expanding

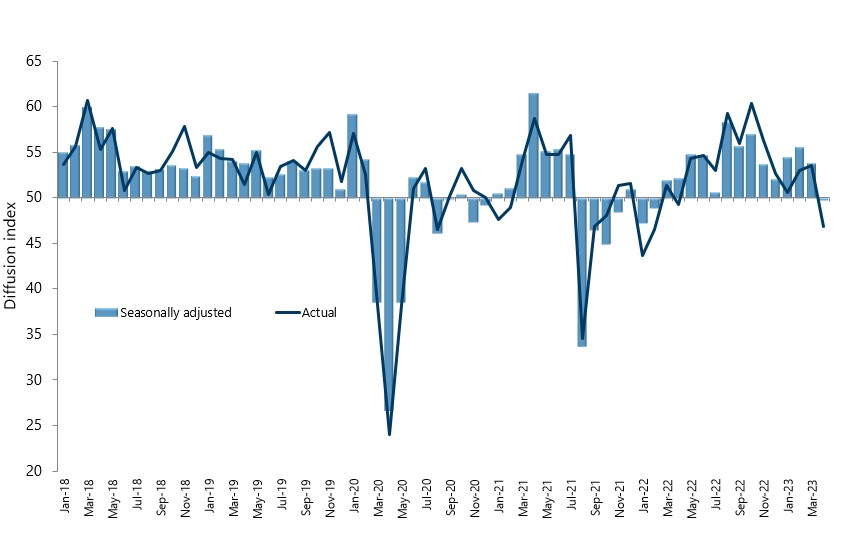
New Zealand’s services sector went into contraction for the first time since February 2022, according to the BNZ – BusinessNZ Performance of Services Index (PSI).

The PSI for April was 49.8 (A PSI reading above 50.0 indicates that the service sector is generally expanding; below 50.0 that it is declining). This was down 4.0 points from March and well below the long-term average of 53.6 for the survey.

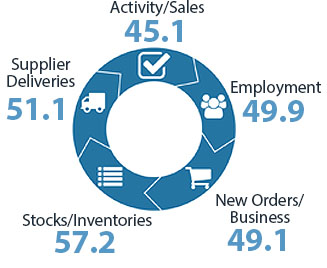
BusinessNZ chief executive Kirk Hope said that while the April result was only slightly in negative territory, the fact that it dropped 4 points from March may indicate a turning point for the sector. In terms of the sub-index results, Activity/Sales (45.1) displayed the largest decline, falling 10.8 points from March. New Orders/Business (49.1) experienced a 3.5 point decline, while Employment (49.9) was all but in no change mode.

“The fall into contraction for April was also mirrored by the movements in the proportion of negative comments, which increased again to 60.2% in April, compared to 58.6% in March and 51.9% in February. A general lack of customer demand seemed to be the main thread common across the comments”.

BNZ Senior Economist Craig Ebert said that “while April’s result denotes only a tiny fraction of contraction, the PSI has certainly slowed a lot, in the space of a month, to the point of a pause”.

Kirk Hope

Kirk Hope

CEO, BusinessNZ

BNZ - BusinessNZ PSI

Time Series Data

View seasonally adjusted and unadjusted time series data for the BNZ - BusinessNZ PSI

Services Landscape

The PSI

In last month’s write-up we described the Performance of Services Index (PSI) as looking good in March, which it was. In April, however, it was not looking good.

Read more

Devilish details

The details of the PSI report reinforce a sense of caution. New Orders/Business kept subsiding to 49.1, for instance, from 52.6 in March and 55.8 in February. The real driver downward, however, has been in Activity/Sales, which sagged to 45.1, from a trend-like 55.9 in March.

Read more

Industry intrigue

The industry detail is also enlightening, as to what lies behind the sudden-stop in the PSI. This came down to the likes of Transport & Storage (24.4), Finance & Insurance (25.0) and Communication (31.3), abruptly giving up positive March positions.

Read more

Not good for GDP

In suddenly going flat in April, the PSI no longer provided the PMI, which was still quivering in the month, a shoulder to cry on.

Read more

Craig Ebert

Craig Ebert

Senior Economist, BNZ

Sponsor Statement

BNZ is delighted to be associated with the Performance of Services Index (PSI) and BusinessNZ.

This association brings together the significant experience of leading business advocacy body BusinessNZ, and business finance specialist BNZ.

We look forward to continuing our association with BusinessNZ and associated regional organisations, and to playing our part in the ongoing development of the New Zealand service sector.

PSI Time Series Table

The results are seasonally adjusted.

National Indicies Apr 2022 Dec 2022 Jan 2023 Feb 2023 Mar 2023 Apr 2023
BNZ – BusinessNZ PSI 52.2 52.1 54.5 55.5 53.8 49.8
Activity/Sales 53.8 52.0 51.9 53.5 55.9 45.1
Employment 51.1 46.8 51.6 51.0 51.2 49.9
New Orders/Business 54.9 57.8 54.1 55.8 52.6 49.1
Stocks/Inventories 54.6 52.0 54.8 58.5 57.4 57.2
Supplier Deliveries 43.0 54.1 51.9 55.4 54.5 51.1

BNZ – BusinessNZ PSI Time Series

January 2016 – April 2023

International Results

J.P. Morgan Global Manufacturing PSITM

06 May 2023
55.4

About the PSI

The BNZ – BusinessNZ Performance of Services Index is a monthly survey of the service sector providing an early indicator of activity levels.

A PSI reading above 50 points indicates service activity is expanding; below 50 indicates it is contracting.

The main PSI and sub-index results are seasonally adjusted.

Technical Contact

Stephen Summers
Economist, BusinessNZ

[email protected]

PSI Releases

Lost momentum

New Zealand’s services sector fell back into contraction during March, according to the BNZ – BusinessNZ Performance of Services Index (PSI). The PSI for March was 47.5 (A PSI reading above 50.0 indicates that the service sector is generally expanding; below 50.0 that...

Path of expansion

New Zealand’s services sector continued its path of expansion in February, according to the BNZ – BusinessNZ Performance of Services Index (PSI). The PSI for February was 53.0 (A PSI reading above 50.0 indicates that the service sector is generally expanding; below...

Green shoots?

New Zealand’s services sector climbed back into expansion for the start of 2024, according to the BNZ – BusinessNZ Performance of Services Index (PSI). The PSI for January was 52.1 (A PSI reading above 50.0 indicates that the service sector is generally expanding;...

Activity on holiday

New Zealand’s services sector fell back into contraction during December, according to the BNZ – BusinessNZ Performance of Services Index (PSI). The PSI for December was 48.8 (A PSI reading above 50.0 indicates that the service sector is generally expanding; below...

Over the line

New Zealand’s services sector recorded expansion in November, according to the BNZ – BusinessNZ Performance of Services Index (PSI). The PSI for November was 51.2 (A PSI reading above 50.0 indicates that the service sector is generally expanding; below 50.0 that it is...

BNZ – BusinessNZ
Performance of
Composite Index

50.3

GDP-Weighted Index

48.5

Free-Weighted Index

The seasonally adjusted BNZ – BusinessNZ Performance of Composite Index or PCI (which combines the PMI and PSI) saw the two options for measuring the PCI both decrease.

The April GDP-Weighted Index (50.3) decreased 2.8 points from March, while the Free-Weighted Index (48.5) dropped 1.5 points to be in contraction for the first time since January 2022.

PCI Time Series Table

The results are seasonally adjusted.

National Indicies Apr 2022 Dec 2022 Jan 2023 Feb 2023 Mar 2023 Apr 2023
GDP-Weighted Index 50.2 51.7 54.0 55.0 53.1 50.3
Free-Weighted Index 51.1 50.7 51.7 53.4 50.0 48.5

BNZ – BusinessNZ PCI Time Series

January 2016 – April 2023

About the PCI

The BNZ – BusinessNZ Performance of Composite Index (PCI) takes into account results from both the Performance of Manufacturing Index (PMI) and the Performance of Services Index (PSI). Combined results are shown in two ways:

GDP-Weighted Index:
Apportions the weight of the manufacturing and services index within the economy to produce an overall result.

Free-Weighted Index:
Combines data from both indexes to produce an overall result.

Both time series for the PCI are then seasonally adjusted.

BNZ - BusinessNZ PCI

Time Series Data

View seasonally adjusted and unadjusted time series data for the BNZ - BusinessNZ PCI

Our Contributors

The BNZ – BusinessNZ PSI contains data obtained through BusinessNZ’s regional organisations