BNZ – BusinessNZ
Performance of
Services Index

Slipping service – PSI

15 Apr, 2019
52.9
March
-0.7

Monthly Change

expanding
slower rate

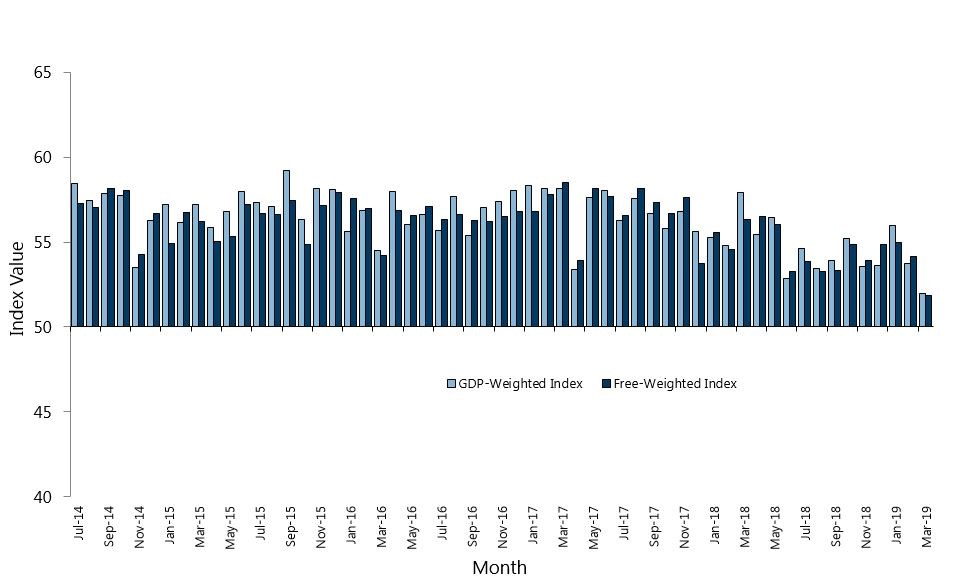
Activity in New Zealand’s services sector slipped to its lowest level since 2012, according to the BNZ – BusinessNZ Performance of Services Index (PSI).

The PSI for March was 52.9, which was 0.7 points down from February, and follows a drop of 2.7 points for the previous month (A PSI reading above 50.0 indicates that the service sector is generally expanding; below 50.0 that it is declining).  The March result was the lowest since December 2012, and below the long term average of 54.5 for the survey.

BusinessNZ chief executive Kirk Hope said that there were a couple of concerning elements that contributed to the easing off of service sector activity for March.

“New orders/business (54.9), which is a key component to overall activity, dropped to its lowest point since September 2012. Activity/sales (52.5) also slipped further, so all eyes will be on these key results in the months ahead to ascertain whether expansion continues its downward trend.

On the positive side, the proportion of positive comments for March (55.8%) was up on February (52.4%) and January (54.0%).  However, many felt it was either business as usual or a general feeling of uncertainty with the current economy”.

BNZ Senior Economist Doug Steel said “the PSI trends remain ok, but a slower March reading heightens focus on the next few months to see if the slower pace is transitory or not”.

Kirk Hope

Kirk Hope

CEO, BusinessNZ

BNZ - BusinessNZ PSI

Time Series Data

View seasonally adjusted and unadjusted time series data for the BNZ - BusinessNZ PSI

Services Landscape

Slower Service

The Performance of Services Index (PSI) eased a touch in March, to 52.9 from 53.6 in February. Not a big move in and of itself, but it does take the index to its lowest point since 2012 and a bit further below its long term average of 54.5.
Read more

Caveats

But, as always, we caution against over-reacting to one month’s data especially when there are events that might generate results that are not representative of the trend.
Read more

Trends OK

At this point, the trends remain steady with the PSI three month moving average steady at 54.3 extending a period of broad stability in this measure to eight months. But, by the same token, we should not dismiss the softer March reading out of hand as it coincides with some slower indicators for housing and tourism.
Read more

Doug Steel

Doug Steel

Senior Economist, BNZ

Sponsor Statement

BNZ is delighted to be associated with the Performance of Services Index (PSI) and BusinessNZ.

This association brings together the significant experience of leading business advocacy body BusinessNZ, and business finance specialist BNZ.

We look forward to continuing our association with BusinessNZ and associated regional organisations, and to playing our part in the ongoing development of the New Zealand service sector.

PSI Time Series Table

The results are seasonally adjusted.

National Indicies Mar
2018
Nov
2018
Dec
2018
Jan
2019
Feb
2019
Mar
2019
BNZ – BusinessNZ PSI 59.4 53.4 53.0 56.3 53.6 52.9
Activity/Sales 64.8 53.3 52.2 61.6 53.4 52.5
Employment 50.7 55.4 50.5 52.6 51.8 50.9
New Orders/Business 64.5 57.8 59.4 60.6 59.2 54.9
Stocks/Inventories 54.4 50.3 51.2 50.0 49.3 49.8
Supplier Deliveries 55.1 48.7 51.8 51.9 50.0 50.8

BNZ – BusinessNZ PSI Time Series

March 2015 – March 2019

International Results

J.P. Morgan Global Manufacturing PSITM

03 Apr 2019
53.7

About the PSI

The BNZ – BusinessNZ Performance of Services Index is a monthly survey of the service sector providing an early indicator of activity levels.

A PSI reading above 50 points indicates service activity is expanding; below 50 indicates it is contracting.

The main PSI and sub-index results are seasonally adjusted.

Technical Contact

Stephen Summers
Economist, BusinessNZ

[email protected]

PSI Releases

Struggle street

New Zealand’s services sector continued to contract further in April, according to the BNZ – BusinessNZ Performance of Services Index (PSI). The PSI for April was 47.1 (A PSI reading above 50.0 indicates that the service sector is generally expanding; below 50.0 that...

Lost momentum

New Zealand’s services sector fell back into contraction during March, according to the BNZ – BusinessNZ Performance of Services Index (PSI). The PSI for March was 47.5 (A PSI reading above 50.0 indicates that the service sector is generally expanding; below 50.0 that...

Path of expansion

New Zealand’s services sector continued its path of expansion in February, according to the BNZ – BusinessNZ Performance of Services Index (PSI). The PSI for February was 53.0 (A PSI reading above 50.0 indicates that the service sector is generally expanding; below...

Green shoots?

New Zealand’s services sector climbed back into expansion for the start of 2024, according to the BNZ – BusinessNZ Performance of Services Index (PSI). The PSI for January was 52.1 (A PSI reading above 50.0 indicates that the service sector is generally expanding;...

Activity on holiday

New Zealand’s services sector fell back into contraction during December, according to the BNZ – BusinessNZ Performance of Services Index (PSI). The PSI for December was 48.8 (A PSI reading above 50.0 indicates that the service sector is generally expanding; below...

BNZ – BusinessNZ
Performance of
Composite Index

52.0

GDP-Weighted Index

51.9

Free-Weighted Index

The seasonally adjusted BNZ – BusinessNZ Performance of Composite Index or PCI (which combines the PMI and PSI) saw the two options for measuring the PCI again both decrease in expansion levels during March.

The March GDP-Weighted Index (52.0) decreased 1.7 points from February, while the Free-Weighted Index (51.9) decreased 2.3 points.  A decrease in expansion levels for both sectors meant there was only direction these were going to go during March.

PCI Time Series Table

The results are seasonally adjusted.

National Indicies Mar
2018
Nov
2018
Dec
2018
Jan
2019
Feb
2019
Mar
2019
GDP-Weighted Index 57.9 53.6 53.6 56.0 53.7 52.0
Free-Weighted Index 56.3 53.9 54.8 55.0 54.2 51.9

BNZ – BusinessNZ PCI Time Series

March 2015 – March 2019

About the PCI

The BNZ – BusinessNZ Performance of Composite Index (PCI) takes into account results from both the Performance of Manufacturing Index (PMI) and the Performance of Services Index (PSI). Combined results are shown in two ways:

GDP-Weighted Index:
Apportions the weight of the manufacturing and services index within the economy to produce an overall result.

Free-Weighted Index:
Combines data from both indexes to produce an overall result.

Both time series for the PCI are then seasonally adjusted.

BNZ - BusinessNZ PCI

Time Series Data

View seasonally adjusted and unadjusted time series data for the BNZ - BusinessNZ PCI

Our Contributors

The BNZ – BusinessNZ PSI contains data obtained through BusinessNZ’s regional organisations