BNZ – BusinessNZ
Performance of
Services Index

Small steps for service sector expansion – PSI

20 Jun, 2011

The service sector continued to show improvement in expansion during May, although at a slow pace, according to the BNZ – BusinessNZ Performance of Services Index (PSI).

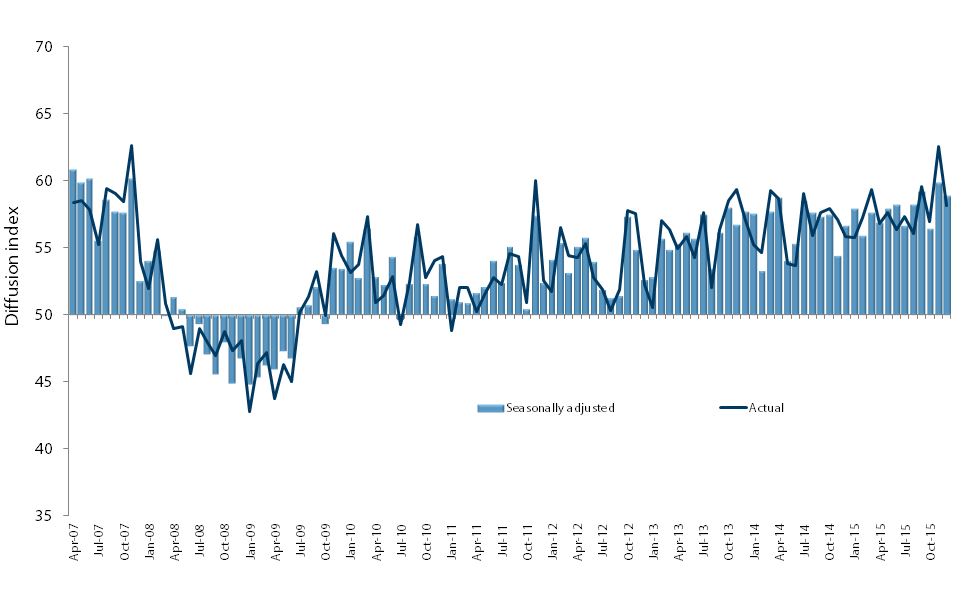
The PSI for May was 52.8. This was up only 0.2 points from April but the highest result since September 2010. A PSI reading above 50.0 indicates that the service sector is generally expanding; below 50.0 that it is declining. The average PSI value for 2009 was 48.8, while for 2010 it was 53.2.

BusinessNZ chief executive Phil O’Reilly said that the gradual improvement in activity for each of the last four months was positive, but there is still a way to go to get consistent expansion across regions and sub-sectors.

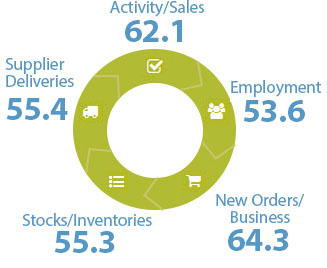
“The recovery could best be described as lumpy, with certain regions and sub-sectors struggling to break into expansion mode. In addition, the sub-index for employment shows businesses still tentative about hiring new staff, although a pick-up in new orders/business for May may help feed through into the other indexes over the next few months.

The BNZ – BusinessNZ Performance of Composite Index (PCI), which combines the results of both the PSI and PMI, shows that both options for measurement improved in May (values of 53.1 and 53.9). Although his level of expansion would not be described as strong, it still represented the highest values since September and June 2010 respectively.

Bank of New Zealand’s senior economist, Craig Ebert, noted that regional divergences are becoming important for the economy.

“This can be paraphrased as Auckland continuing to lead the way, rural-based areas rapidly catching up on the back of booming commodity income, Wellington capped by way of the Budget, and Christchurch severely disrupted. Internal and external migration trends will also be well worth watching, amid limited population growth for New Zealand as a whole.”

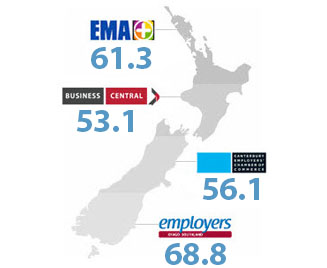
Activity by region showed most areas in expansion during May. The Central region (56.6) returned to robust levels of expansion after a dip in April, while the Northern region (52.1) returned to growth.  The Canterbury/Westland region (50.2) bordered on a level of no change for May after a bounce back in April, while the Otago/Southland region (39.3) fell back to similar levels of decline in February and March.

Click here to view the May PSI & PCI
Click here to view the PSI time series data
Click here to view the PCI time series data

For media comment: Craig Ebert 04 474 6799

BNZ - BusinessNZ PSI

Time Series Data

View seasonally adjusted and unadjusted time series data for the BNZ - BusinessNZ PSI

Services Landscape

Sponsor Statement

BNZ is delighted to be associated with the Performance of Services Index (PSI) and BusinessNZ.

This association brings together the significant experience of leading business advocacy body BusinessNZ, and business finance specialist BNZ.

We look forward to continuing our association with BusinessNZ and associated regional organisations, and to playing our part in the ongoing development of the New Zealand service sector.

PSI Time Series Table

The results are seasonally adjusted.

BNZ – BusinessNZ PSI Time Series

January 1966 – January 1970

International Results

J.P. Morgan Global Manufacturing PSITM

About the PSI

The BNZ – BusinessNZ Performance of Services Index is a monthly survey of the service sector providing an early indicator of activity levels.

A PSI reading above 50 points indicates service activity is expanding; below 50 indicates it is contracting.

The main PSI and sub-index results are seasonally adjusted.

Technical Contact

Stephen Summers
Economist, BusinessNZ

[email protected]

PSI Releases

Lost momentum

New Zealand’s services sector fell back into contraction during March, according to the BNZ – BusinessNZ Performance of Services Index (PSI). The PSI for March was 47.5 (A PSI reading above 50.0 indicates that the service sector is generally expanding; below 50.0 that...

Path of expansion

New Zealand’s services sector continued its path of expansion in February, according to the BNZ – BusinessNZ Performance of Services Index (PSI). The PSI for February was 53.0 (A PSI reading above 50.0 indicates that the service sector is generally expanding; below...

Green shoots?

New Zealand’s services sector climbed back into expansion for the start of 2024, according to the BNZ – BusinessNZ Performance of Services Index (PSI). The PSI for January was 52.1 (A PSI reading above 50.0 indicates that the service sector is generally expanding;...

Activity on holiday

New Zealand’s services sector fell back into contraction during December, according to the BNZ – BusinessNZ Performance of Services Index (PSI). The PSI for December was 48.8 (A PSI reading above 50.0 indicates that the service sector is generally expanding; below...

Over the line

New Zealand’s services sector recorded expansion in November, according to the BNZ – BusinessNZ Performance of Services Index (PSI). The PSI for November was 51.2 (A PSI reading above 50.0 indicates that the service sector is generally expanding; below 50.0 that it is...

BNZ – BusinessNZ
Performance of
Composite Index

PCI Time Series Table

The results are seasonally adjusted.

BNZ – BusinessNZ PCI Time Series

January 1966 – January 1970

About the PCI

The BNZ – BusinessNZ Performance of Composite Index (PCI) takes into account results from both the Performance of Manufacturing Index (PMI) and the Performance of Services Index (PSI). Combined results are shown in two ways:

GDP-Weighted Index:
Apportions the weight of the manufacturing and services index within the economy to produce an overall result.

Free-Weighted Index:
Combines data from both indexes to produce an overall result.

Both time series for the PCI are then seasonally adjusted.

BNZ - BusinessNZ PCI

Time Series Data

View seasonally adjusted and unadjusted time series data for the BNZ - BusinessNZ PCI

Our Contributors

The BNZ – BusinessNZ PSI contains data obtained through BusinessNZ’s regional organisations