BNZ – BusinessNZ
Performance of
Services Index

Solid start to 2019 – PSI

18 Feb, 2019
56.3
January
+3.1

Monthly Change

expanding
faster rate

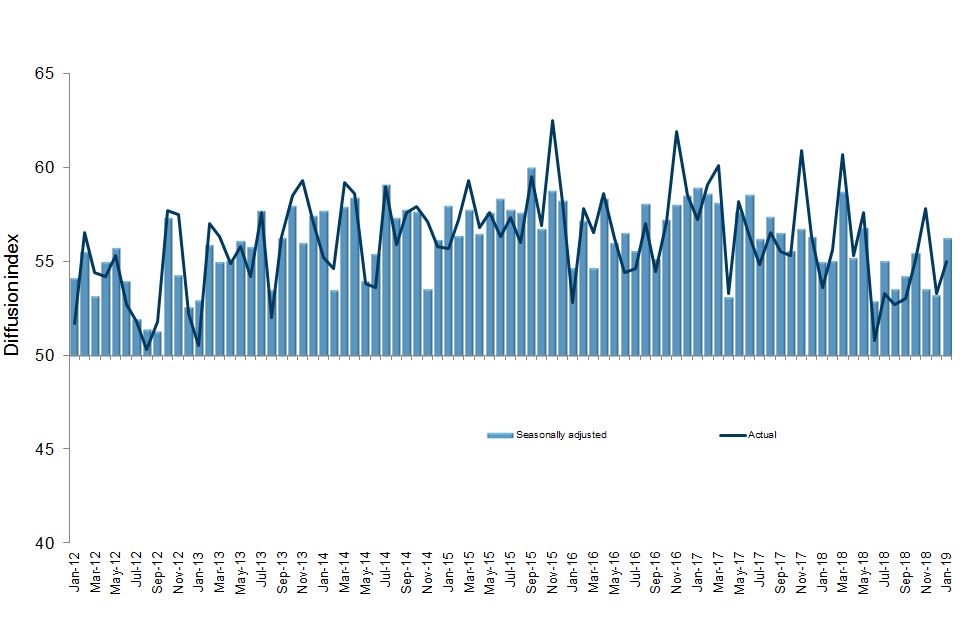
New Zealand’s services sector experienced an increase in expansion levels for the first month of 2019, according to the BNZ – BusinessNZ Performance of Services Index (PSI).

The PSI for January was 56.3, which was 3.1 points up from December (A PSI reading above 50.0 indicates that the service sector is generally expanding; below 50.0 that it is declining).  This was the highest level of expansion since May, and above the long term average of 54.5 for the survey.

BusinessNZ chief executive Kirk Hope said that it was good to see 2019 start off on solid expansion grounds.

“It was particularly good to see the key sub-indicators of activity/sales (61.5) and new orders/business (61.4) both above the 60-point mark, with the former at its highest level since March 2018.

Despite the rise in overall activity levels, the proportion of positive comments in January (54.0%) was almost exactly the same as December (54.4%), but lower than both November (60.1%) and October (56.5%).  Both Xmas and holidays were again the stand out reasons for negative comments, while a number of positive comments outlined new clients and business opportunities for the new year”. 

BNZ Senior Economist Craig Ebert said “January’s PSI suggests that the services sector is still chugging along relatively well, as we head into 2019, rather than fading as a backbone to GDP growth”.

Kirk Hope

Kirk Hope

CEO, BusinessNZ

BNZ - BusinessNZ PSI

Time Series Data

View seasonally adjusted and unadjusted time series data for the BNZ - BusinessNZ PSI

Services Landscape

More Substance

New Zealand’s Performance of Services Index (PSI) started 2019 with more substance, having ended 2018 on a moderate note. In numbers, it sprang to a seasonally adjusted 56.3 in January, from 53.2 in December.
Read more

Positive on GDP

By improving a fair bit in January, the PSI helped support our economic views on a number of levels. For a start, it went some way to offsetting the moderation in the PMI in the month, which dipped to 53.1, from 54.8 in December.
Read more

Positive on Employment

January’s PSI also supports our view that employment growth continues to tick along relatively well. The PSI’s job index, having virtually stalled in December, with 50.3, rebounded to a seasonally adjusted 52.9 in January.
Read more

Retail Rebound

A more specific area where the latest PSI has calmed nerves is with regard to retailing. Of course, we’ve already seen electronic card transactions bounce back with force in January, from an unusually large drop in December.
Read more

Craig Ebert

Craig Ebert

Senior Economist, BNZ

Sponsor Statement

BNZ is delighted to be associated with the Performance of Services Index (PSI) and BusinessNZ.

This association brings together the significant experience of leading business advocacy body BusinessNZ, and business finance specialist BNZ.

We look forward to continuing our association with BusinessNZ and associated regional organisations, and to playing our part in the ongoing development of the New Zealand service sector.

PSI Time Series Table

The results are seasonally adjusted.

National Indicies Jan
2018
Sep
2018
Oct
2018
Nov
2018
Dec
2018
Jan
2019
BNZ – BusinessNZ PSI 55.0 54.2 55.5 53.6 53.2 56.3
Activity/Sales 59.1 56.0 57.5 53.4 52.3 61.5
Employment 50.7 50.2 53.7 55.5 50.3 52.9
New Orders/Business 58.2 56.4 58.5 57.8 59.6 61.4
Stocks/Inventories 53.2 53.5 51.9 50.3 51.2 49.9
Supplier Deliveries 53.4 52.3 51.1 48.7 51.7 51.9

BNZ – BusinessNZ PSI Time Series

January 2015 – January 2019

International Results

J.P. Morgan Global Manufacturing PSITM

05 Feb 2019
52.6

About the PSI

The BNZ – BusinessNZ Performance of Services Index is a monthly survey of the service sector providing an early indicator of activity levels.

A PSI reading above 50 points indicates service activity is expanding; below 50 indicates it is contracting.

The main PSI and sub-index results are seasonally adjusted.

Technical Contact

Stephen Summers
Economist, BusinessNZ

[email protected]

PSI Releases

Struggle street

New Zealand’s services sector continued to contract further in April, according to the BNZ – BusinessNZ Performance of Services Index (PSI). The PSI for April was 47.1 (A PSI reading above 50.0 indicates that the service sector is generally expanding; below 50.0 that...

Lost momentum

New Zealand’s services sector fell back into contraction during March, according to the BNZ – BusinessNZ Performance of Services Index (PSI). The PSI for March was 47.5 (A PSI reading above 50.0 indicates that the service sector is generally expanding; below 50.0 that...

Path of expansion

New Zealand’s services sector continued its path of expansion in February, according to the BNZ – BusinessNZ Performance of Services Index (PSI). The PSI for February was 53.0 (A PSI reading above 50.0 indicates that the service sector is generally expanding; below...

Green shoots?

New Zealand’s services sector climbed back into expansion for the start of 2024, according to the BNZ – BusinessNZ Performance of Services Index (PSI). The PSI for January was 52.1 (A PSI reading above 50.0 indicates that the service sector is generally expanding;...

Activity on holiday

New Zealand’s services sector fell back into contraction during December, according to the BNZ – BusinessNZ Performance of Services Index (PSI). The PSI for December was 48.8 (A PSI reading above 50.0 indicates that the service sector is generally expanding; below...

BNZ – BusinessNZ
Performance of
Composite Index

56.1

GDP-Weighted Index

55.3

Free-Weighted Index

The seasonally adjusted BNZ – BusinessNZ Performance of Composite Index or PCI (which combines the PMI and PSI) saw the two options for measuring the PCI again both improve during January.

The January GDP-Weighted Index (56.1) increased 2.3 points from December, while the Free-Weighted Index (55.3) rose 0.2 points.  The fact that the services sector experienced a solid increase in expansion while the manufacturing sector fell back slightly meant the GDP-Weighted Index improved by a greater margin for the beginning of 2019.

PCI Time Series Table

The results are seasonally adjusted.

National Indicies Jan
2018
Sep
2018
Oct
2018
Nov
2018
Dec
2018
Jan
2019
GDP-Weighted Index 55.4 53.9 55.2 53.6 53.8 56.1
Free-Weighted Index 55.9 53.3 54.7 53.9 55.1 55.3

BNZ – BusinessNZ PCI Time Series

January 2015 – January 2019

About the PCI

The BNZ – BusinessNZ Performance of Composite Index (PCI) takes into account results from both the Performance of Manufacturing Index (PMI) and the Performance of Services Index (PSI). Combined results are shown in two ways:

GDP-Weighted Index:
Apportions the weight of the manufacturing and services index within the economy to produce an overall result.

Free-Weighted Index:
Combines data from both indexes to produce an overall result.

Both time series for the PCI are then seasonally adjusted.

BNZ - BusinessNZ PCI

Time Series Data

View seasonally adjusted and unadjusted time series data for the BNZ - BusinessNZ PCI

Our Contributors

The BNZ – BusinessNZ PSI contains data obtained through BusinessNZ’s regional organisations