BNZ – BusinessNZ
Performance of
Services Index

Solid territory – PSI

20 Jun, 2016
56.9
May
-0.9

Monthly Change

expanding
slower rate

New Zealand’s services sector continued to show solid levels of expansion in May, according to the BNZ – BusinessNZ Performance of Services Index (PSI).
 
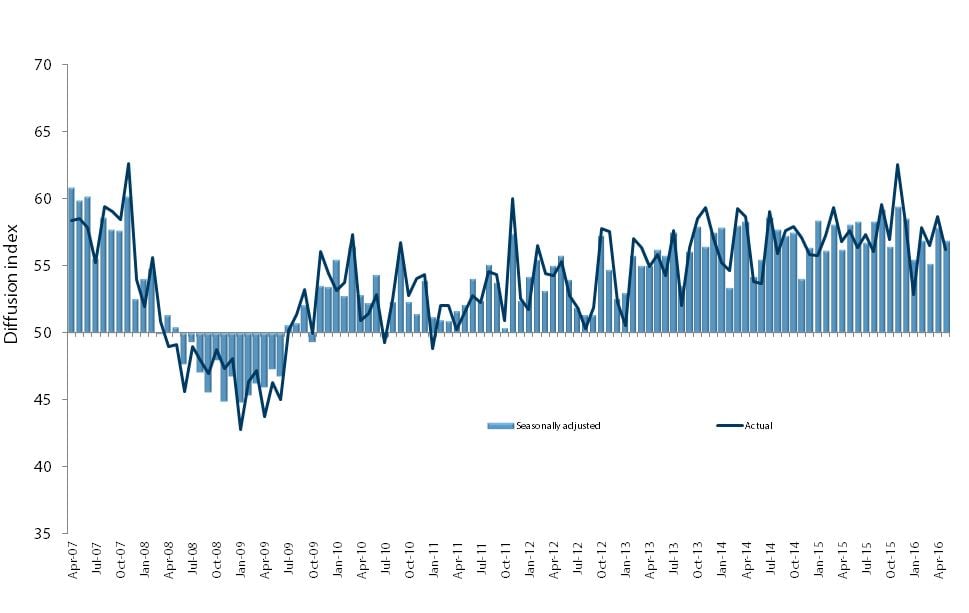
The PSI for May was 56.9.  While this was 0.9 points lower than April, this was the same level of activity as February, and continues a post-55 level of expansion since November 2014 (A PSI reading above 50.0 indicates that the service sector is generally expanding; below 50.0 that it is declining).
 
BusinessNZ chief executive Kirk Hope said that despite the slightly lower level of expansion for May, the fundamentals behind the main PSI result were still positive.
 
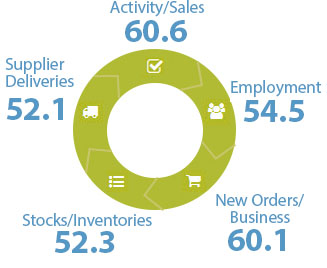
“Both activity/sales (60.6) and new orders/business (60.1) continued to keep their head above the 60-point mark, while employment (54.5) was at its highest level since November 2015. In addition, the proportion of positive comments (67.6%) tended to outline a combination of a continued market demand and new market opportunities for a sizeable number of businesses.”
 
Regarding the latest PSI result, BNZ Senior Economist Doug Steel said ‘New Zealand’s current economic expansion is being underpinned by a rising population and booming tourism. With labour demand also buoyant, it is all helping lift sales activity including across the service sectors.’

Kirk Hope

Kirk Hope

CEO, BusinessNZ

BNZ - BusinessNZ PSI

Time Series Data

View seasonally adjusted and unadjusted time series data for the BNZ - BusinessNZ PSI

Services Landscape

More pop

Latest figures show the economy grew 2.8% in the year to March 2016. The current expansion is underpinned by more people with the population rising 2.1% over the period to 4.66 million (with some per capita growth as well).

Read more  

More people

Meanwhile, the tourism boom thunders on. A huge influx of tourist arrivals over recent years has added to the pervasive influence that more people are having on economic activity.

Read more  

More employment

Another encouraging feature of today’s PSI report was another tick higher in the employment index. In rising to 54.5 in May, from 53.8 in April, it pushed further above its long term average of 51.3.

Read more  

More sales

The people effect is reflected in many areas such as the housing market via more house sales, higher prices, and increasing house construction. Commercial accommodation providers are seeing occupancy rates trend firmly higher.

Read more .

Doug Steel

Doug Steel

Senior Economist, BNZ

Sponsor Statement

BNZ is delighted to be associated with the Performance of Services Index (PSI) and BusinessNZ.

This association brings together the significant experience of leading business advocacy body BusinessNZ, and business finance specialist BNZ.

We look forward to continuing our association with BusinessNZ and associated regional organisations, and to playing our part in the ongoing development of the New Zealand service sector.

PSI Time Series Table

The results are seasonally adjusted.

National Indicies May
2015
Jan
2015
Feb
2016
Mar
2016
Apr
2016
May
2016
BNZ – BusinessNZ PSI 58.1 55.4 56.9 55.1 57.8 56.9
Activity/Sales 62.8 58.2 60.3 59.9 63.2 60.6
Employment 55.1 51.1 53.7 53.0 53.8 54.5
New Orders/Business 63.1 57.0 61.2 57.4 61.4 60.1
Stocks/Inventories 51.3 54.2 54.8 52.5 52.4 52.3
Supplier Deliveries 51.6 54.7 53.3 51.2 54.3 52.1

BNZ – BusinessNZ PSI Time Series

May 2011 – May 2015

International Results

J.P. Morgan Global Manufacturing PSITM

03 Jun 2016
51.4

About the PSI

The BNZ – BusinessNZ Performance of Services Index is a monthly survey of the service sector providing an early indicator of activity levels.

A PSI reading above 50 points indicates service activity is expanding; below 50 indicates it is contracting.

The main PSI and sub-index results are seasonally adjusted.

Technical Contact

Stephen Summers
Economist, BusinessNZ

[email protected]

PSI Releases

Struggle street

New Zealand’s services sector continued to contract further in April, according to the BNZ – BusinessNZ Performance of Services Index (PSI). The PSI for April was 47.1 (A PSI reading above 50.0 indicates that the service sector is generally expanding; below 50.0 that...

Lost momentum

New Zealand’s services sector fell back into contraction during March, according to the BNZ – BusinessNZ Performance of Services Index (PSI). The PSI for March was 47.5 (A PSI reading above 50.0 indicates that the service sector is generally expanding; below 50.0 that...

Path of expansion

New Zealand’s services sector continued its path of expansion in February, according to the BNZ – BusinessNZ Performance of Services Index (PSI). The PSI for February was 53.0 (A PSI reading above 50.0 indicates that the service sector is generally expanding; below...

Green shoots?

New Zealand’s services sector climbed back into expansion for the start of 2024, according to the BNZ – BusinessNZ Performance of Services Index (PSI). The PSI for January was 52.1 (A PSI reading above 50.0 indicates that the service sector is generally expanding;...

Activity on holiday

New Zealand’s services sector fell back into contraction during December, according to the BNZ – BusinessNZ Performance of Services Index (PSI). The PSI for December was 48.8 (A PSI reading above 50.0 indicates that the service sector is generally expanding; below...

BNZ – BusinessNZ
Performance of
Composite Index

56.9

GDP-Weighted Index

57.4

Free-Weighted Index

The seasonally adjusted BNZ – BusinessNZ Performance of Composite Index or PCI (which combines the PMI and PSI) saw the two options for measuring the PCI experience differing directions of activity from April to May.
 
The May GDP-Weighted Index (56.9) decreased 0.8 points from April, while the Free-Weighted Index (57.4) rose 0.1 points. The decrease in the former was due to the services sector experiencing slightly lower levels of activity, while the latter was influenced by stronger activity in the manufacturing sector.

PCI Time Series Table

The results are seasonally adjusted.

National Indicies May
2015
Jan
2016
Feb
2016
Mar
2016
Apr
2016
May
2016
GDP-Weighted Index 57.2 56.0 56.6 55.1 57.7 56.9
Free-Weighted Index 55.8 57.4 56.9 55.1 57.3 57.4

BNZ – BusinessNZ PCI Time Series

May 2011 – May 2015

About the PCI

The BNZ – BusinessNZ Performance of Composite Index (PCI) takes into account results from both the Performance of Manufacturing Index (PMI) and the Performance of Services Index (PSI). Combined results are shown in two ways:

GDP-Weighted Index:
Apportions the weight of the manufacturing and services index within the economy to produce an overall result.

Free-Weighted Index:
Combines data from both indexes to produce an overall result.

Both time series for the PCI are then seasonally adjusted.

BNZ - BusinessNZ PCI

Time Series Data

View seasonally adjusted and unadjusted time series data for the BNZ - BusinessNZ PCI

Our Contributors

The BNZ – BusinessNZ PSI contains data obtained through BusinessNZ’s regional organisations