BNZ – BusinessNZ
Performance of Services Index

BNZ – BusinessNZ
Performance of
Services Index

Three on the trot

51.2

August

+0.6

Monthly Change

Expanding

Faster Rate

According to the BNZ – BusinessNZ Performance of Services Index (PSI), New Zealand’s services sector continued to expand in August, extending its run of growth to three consecutive months.

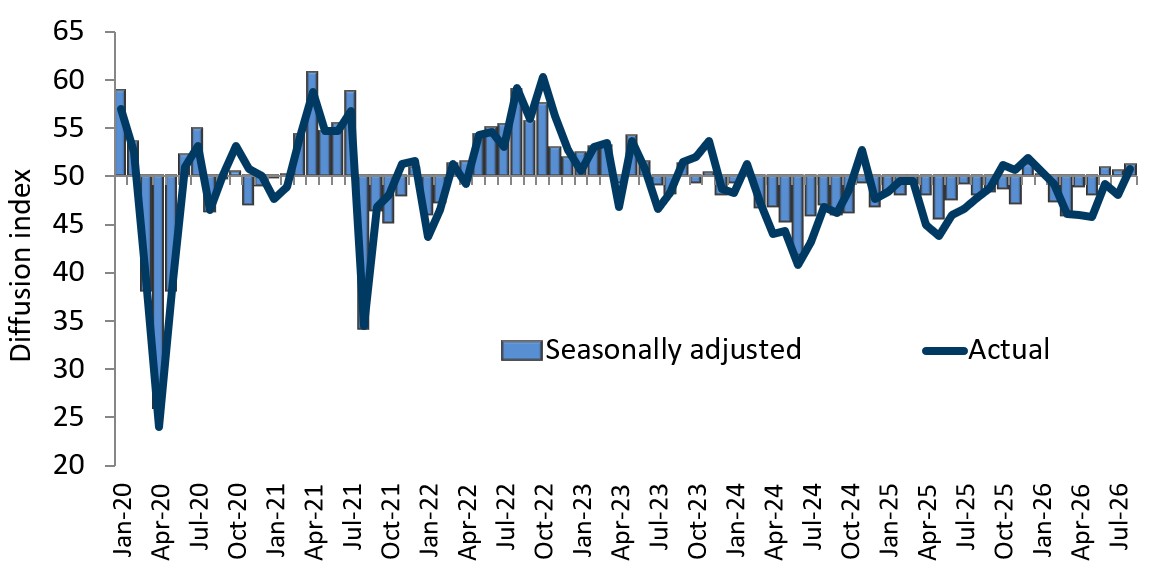
The PSI for August was 51.2 (where a reading above 50.0 indicates the sector is generally expanding, and a reading below 50.0 indicates the sector is in contraction). This was up slightly from 50.6 in July, and above 50.9 in June. August’s reading matches December 2025, and is the highest the PSI has been since September 2023.

BusinessNZ’s CEO, Katherine Rich said “It’s encouraging to see the PSI post its strongest reading since returning to growth, though at 51.2 this remains a fragile recovery. With three of the five sub-indices still below 50, there’s clearly more ground to make up before we can call this a solid turnaround.”

The respondent comments showed that cost of living pressures, interest rates, and election uncertainty remain front of mind for many. Sentiment softened compared to July, with 60.8% of comments negative.

New Orders/Business was the strongest sub-index, at 55.2, followed by Stocks/Inventories at 50.8. Supplier Deliveries was the weakest at 49.0, with Employment and Activity/Sales also soft at 49.4 apiece, a reminder that the recovery remains narrowly based.

BNZ Senior Economist, Doug Steel said “The PSI’s three-month moving average keeps rising and, at 50.9, is at its highest level since July 2023. This gives some confidence that the sector is trending upwards, even if the recovery remains fragile.”


Activity/Sales
49.4
Employment
49.4
New Orders/
Business
55.2
Stocks/Inventories
50.8
Supplier
Deliveries
49.0
48.8
52.1
55.4
48.1

Katherine Rich

CEO, BusinessNZ

Services Landscape

Fragile but improving

The services sector continues to move forward, albeit at a slow pace. The Performance of Services Index (PSI) reached 51.2 in August, above last month’s 50.6 print but below its long-term average of 52.7.

Read more

New orders lead the way

New orders, at 55.2, continues to hold up the PSI and offers hope for broader improvement ahead. However, all subindexes remain below their long-term averages.

Read more

Most industries expanding

On an unadjusted basis, most industries expanded over August, albeit at varying paces. Transport and storage had the strongest read of 64.1, unsurprising given its association with the strong external sector.

Read more

A positive outlook for GDP remains

The PMI and PSI together gives a composite activity indicator consistent with annual GDP growth of around 2% y/y. This is broadly in line with our GDP growth forecasts for the second half of the year.

Read more

Doug Steel

Senior Economist, BNZ

Sponsor Statement

BNZ is delighted to be associated with the Performance of Services Index (PSI) and BusinessNZ.

This association brings together the significant experience of leading business advocacy body BusinessNZ, and business finance specialist BNZ.

We look forward to continuing our association with BusinessNZ and associated regional organisations, and to playing our part in the ongoing development of the New Zealand service sector.

PSI Time Series Table

The results are seasonally adjusted

National Indicies Aug 2025 Apr 2026 May 2026 Jun 2026 Jul 2026 Aug 2026
BNZ – BusinessNZ PSI 48.1 48.9 48.0 50.9 50.6 51.2
Activity/Sales 47.0 48.7 45.2 49.6 50.4 49.4
Employment 48.2 48.6 48.7 48.8 48.5 49.4
New Orders/Business 48.4 51.1 48.4 53.5 52.8 55.2
Stocks/Inventories 47.4 48.0 48.1 50.3 51.7 50.8
Supplier Deliveries 48.0 46.8 49.7 51.1 48.4 49.0

BNZ - BusinessNZ PSI Time Series

January 2020 – August 2026

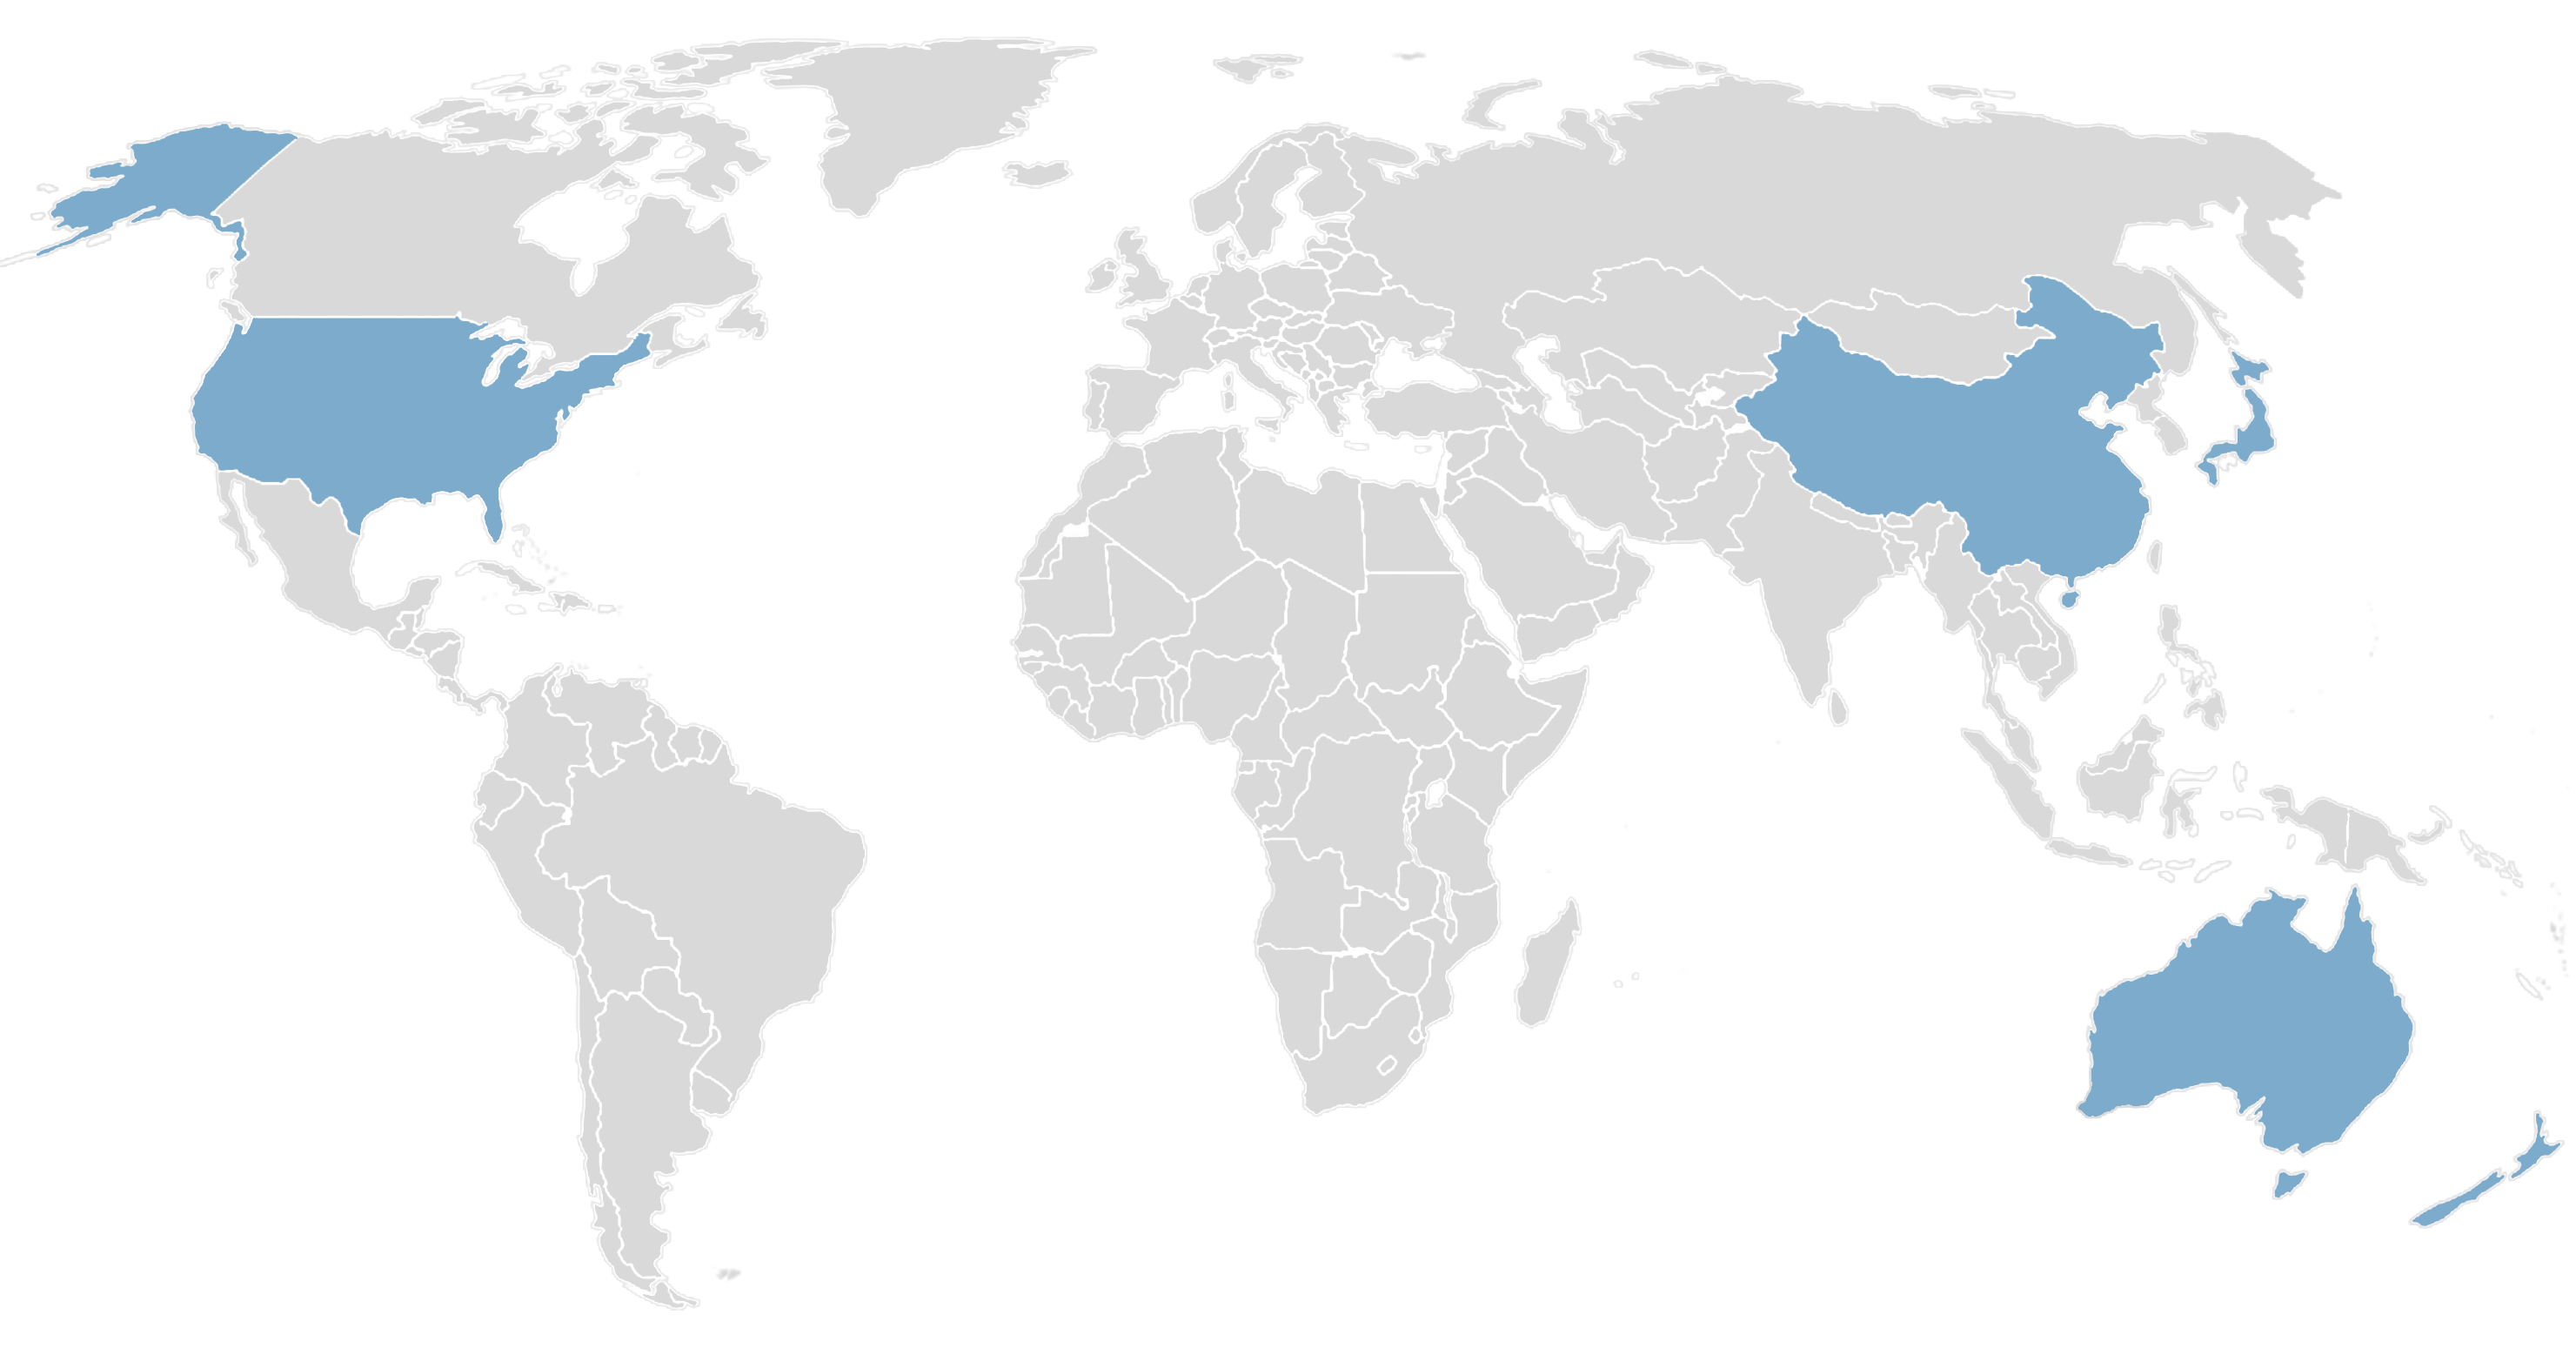
International Results

J.P. Morgan Global Manufacturing PSI

05 Aug 2026
52.5
USA
54.6
UK
52.1
Eurozone
51.7
China
50.4
Japan
51.2
Australia
53.6
NZ
50.6

About The PSI

The BNZ – BusinessNZ Performance of Services Index is a monthly survey of the service sector providing an early indicator of activity levels.

A PSI reading above 50 points indicates service activity is expanding; below 50 indicates it is contracting.

The main PSI and sub-index results are seasonally adjusted.

Technical Contact

Max Doyle
Economist, BusinessNZ

[email protected]

BNZ – BusinessNZ
Performance of
Composite Index

51.6

GDP-Weighted Index

52.5

Free-Weighted Index

Reflecting the continued expansion in both the PMI and the PSI, the seasonally adjusted BNZ – BusinessNZ Performance of Composite Index or PCI (which combines the PMI and PSI) held onto its expansion in August, extending its run of growth. Both the Manufacturing component of the PCI and the Services component remained in expansion.

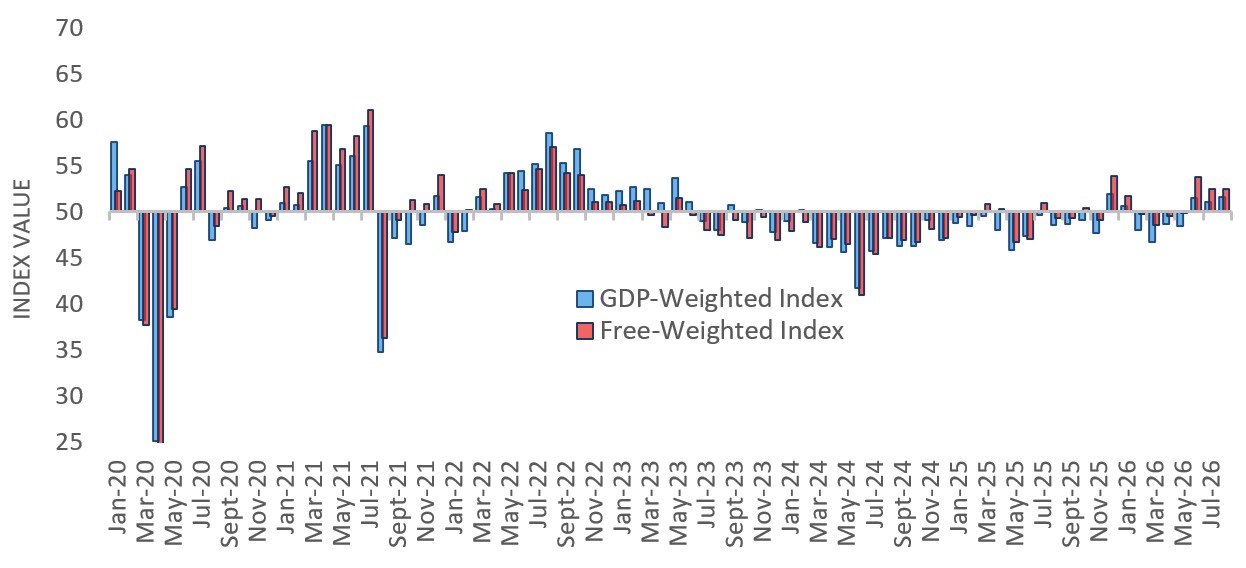
The GDP-weighted index edged up slightly to 51.6 in August, from 51.1 in July, while the Free-weighted index held steady at 52.5.

PCI Time Series Table

The results are seasonally adjusted

National Indicies Aug 2025 Mar 2026 Apr 2026 May 2026 Jun 2026 Jul 2026 Aug 2026
GDP-Weighted Index 48.5 46.7 48.7 48.5 51.5 51.1 51.6
Free-Weighted Index 49.3 48.5 49.5 50.0 53.8 52.5 52.5

BNZ - BusinessNZ PCI Time Series

January 2020 – August 2026

About The PCI

The BNZ – BusinessNZ Performance of Composite Index (PCI) takes into account results from both the Performance of Manufacturing Index (PMI) and the Performance of Services Index (PSI). Combined results are shown in two ways:

GDP-Weighted Index:
Apportions the weight of the manufacturing and services index within the economy to produce an overall result.

Free-Weighted Index:
Combines data from both indexes to produce an overall result.

Both time series for the PCI are then seasonally adjusted.

Our Contributors

The BNZ – BusinessNZ PSI contains data obtained through BusinessNZ’s regional organisations