BNZ – BusinessNZ
Performance of
Services Index

Winter chills

14 Aug, 2023
47.8
July
-1.8

Monthly Change

Contracting
Faster Rate

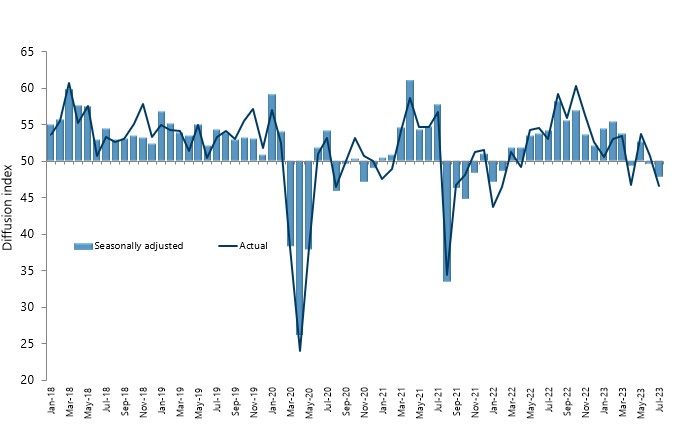
New Zealand’s services sector experienced further contraction during July, according to the BNZ – BusinessNZ Performance of Services Index (PSI).

The PSI for July was 47.8 (A PSI reading above 50.0 indicates that the service sector is generally expanding; below 50.0 that it is declining). This was down 1.8 points from June, and the lowest level of activity for the sector since January 2022. It was also well below the long-term average of 53.5 for the survey.

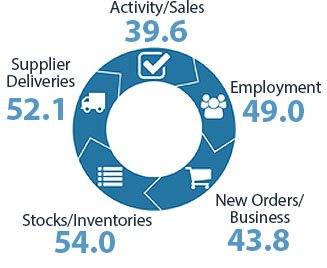
BusinessNZ chief executive Kirk Hope said that there were a few key concerns with the July result. While not all of the five main sub index measures were in contraction, the two key indicators of Activity/Sales (39.6) and New Orders/Business (43.8) experienced a sharp decline, with the former at its lowest point since August 2021 when the country last experienced a lock-down. In fact, it is the lowest result for Activity/Sales that was not lock-down related since the survey began in 2007.

“The further fall into contraction during July also saw another lift in the proportion of negative comments, which rose to 67%, compared with 55.6% in June and 49.4% in May. Overall, negative comments received were strongly dominated by a general downturn in the economic conditions/slowing economy, as well as ongoing increased costs”.

BNZ Senior Economist Doug Steel said that “the results all point to a sharp drop in demand in July, significantly accelerating the slowing trend that had been evident for many months”.

Kirk Hope

Kirk Hope

CEO, BusinessNZ

BNZ - BusinessNZ PSI

Time Series Data

View seasonally adjusted and unadjusted time series data for the BNZ - BusinessNZ PSI

Services Landscape

Demand Drops

Service sector activity took a clear hit in July. The Performance of Services Index (PSI) fell to 47.8 from 49.6 in June. That is concerning enough given it has pushed below the breakeven 50 mark indicating contraction for a significant share of the economy.

Read more

Not Enough Positives

It wasn’t all bad. Cultural, Recreational & Personal stood out among industries with a very positive unadjusted 63.1 reading. Accommodation, Cafes & Restaurants was also better than most, albeit only marginally positive at 50.5. It is difficult to know how much the FIFA Women’s World Cup supported activity among these industries.

Read more

Not A Good Combo

The PSI follows the release of a soft PMI last week. This puts the average composite (PCI) measure meaningfully under 50, at 47.5. That is not a good look for GDP heading into the second half of the year. We think GDP managed some growth in Q2 but see that as the economy bumping along the bottom.

Read more

Doug Steel

Doug Steel

Senior Economist, BNZ

Sponsor Statement

BNZ is delighted to be associated with the Performance of Services Index (PSI) and BusinessNZ.

This association brings together the significant experience of leading business advocacy body BusinessNZ, and business finance specialist BNZ.

We look forward to continuing our association with BusinessNZ and associated regional organisations, and to playing our part in the ongoing development of the New Zealand service sector.

PSI Time Series Table

The results are seasonally adjusted.

National Indicies Jul 2022 Mar 2023 Apr 2023 May 2023 Jun 2023 Jul 2023
BNZ – BusinessNZ PSI 54.1 53.7 49.4 52.6 49.6 47.8
Activity/Sales 55.9 56.1 45.2 51.5 50.9 39.6
Employment 49.1 51.3 50.1 52.2 49.1 49.0
New Orders/Business 55.6 52.8 49.8 54.9 50.4 43.8
Stocks/Inventories 53.2 57.3 56.5 56.2 47.2 54.0
Supplier Deliveries 47.9 54.2 50.3 50.9 51.0 52.1

BNZ – BusinessNZ PSI Time Series

January 2016 – July 2023

International Results

J.P. Morgan Global Manufacturing PSITM

03 Aug 2023
52.7

About the PSI

The BNZ – BusinessNZ Performance of Services Index is a monthly survey of the service sector providing an early indicator of activity levels.

A PSI reading above 50 points indicates service activity is expanding; below 50 indicates it is contracting.

The main PSI and sub-index results are seasonally adjusted.

Technical Contact

Stephen Summers
Economist, BusinessNZ

[email protected]

PSI Releases

Lost momentum

New Zealand’s services sector fell back into contraction during March, according to the BNZ – BusinessNZ Performance of Services Index (PSI). The PSI for March was 47.5 (A PSI reading above 50.0 indicates that the service sector is generally expanding; below 50.0 that...

Path of expansion

New Zealand’s services sector continued its path of expansion in February, according to the BNZ – BusinessNZ Performance of Services Index (PSI). The PSI for February was 53.0 (A PSI reading above 50.0 indicates that the service sector is generally expanding; below...

Green shoots?

New Zealand’s services sector climbed back into expansion for the start of 2024, according to the BNZ – BusinessNZ Performance of Services Index (PSI). The PSI for January was 52.1 (A PSI reading above 50.0 indicates that the service sector is generally expanding;...

Activity on holiday

New Zealand’s services sector fell back into contraction during December, according to the BNZ – BusinessNZ Performance of Services Index (PSI). The PSI for December was 48.8 (A PSI reading above 50.0 indicates that the service sector is generally expanding; below...

Over the line

New Zealand’s services sector recorded expansion in November, according to the BNZ – BusinessNZ Performance of Services Index (PSI). The PSI for November was 51.2 (A PSI reading above 50.0 indicates that the service sector is generally expanding; below 50.0 that it is...

BNZ – BusinessNZ
Performance of
Composite Index

48.0

GDP-Weighted Index

47.1

Free-Weighted Index

The seasonally adjusted BNZ – BusinessNZ Performance of Composite Index or PCI (which combines the PMI and PSI) saw the two options for measuring the PCI both decrease further.

The July GDP-Weighted Index (48.0) fell 1.6 points from June, while the Free-Weighted Index (47.1) also decreased 1.6 points.

PCI Time Series Table

The results are seasonally adjusted.

National Indicies Jul 2022 Mar 2023 Apr 2023 May 2023 Jun 2023 Jul 2023
GDP-Weighted Index 54.2 53.2 50.2 52.4 49.6 48.0
Free-Weighted Index 53.7 50.1 48.5 50.6 48.7 47.1

BNZ – BusinessNZ PCI Time Series

January 2016 – July 2023

About the PCI

The BNZ – BusinessNZ Performance of Composite Index (PCI) takes into account results from both the Performance of Manufacturing Index (PMI) and the Performance of Services Index (PSI). Combined results are shown in two ways:

GDP-Weighted Index:
Apportions the weight of the manufacturing and services index within the economy to produce an overall result.

Free-Weighted Index:
Combines data from both indexes to produce an overall result.

Both time series for the PCI are then seasonally adjusted.

BNZ - BusinessNZ PCI

Time Series Data

View seasonally adjusted and unadjusted time series data for the BNZ - BusinessNZ PCI

Our Contributors

The BNZ – BusinessNZ PSI contains data obtained through BusinessNZ’s regional organisations